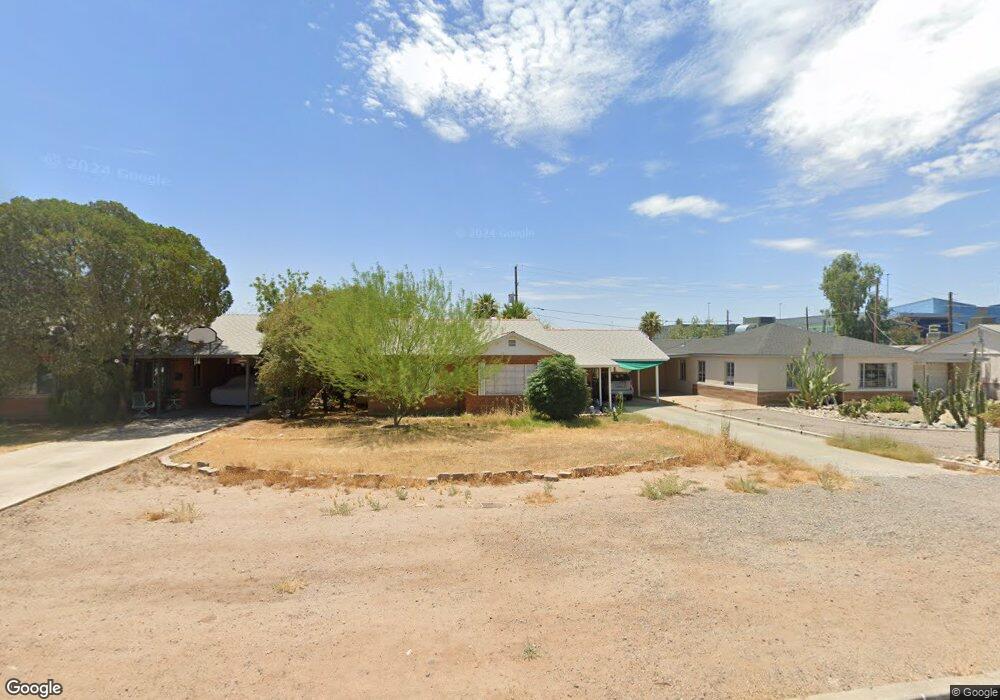
2325 W Colter St Phoenix, AZ 85015
Alhambra NeighborhoodEstimated Value: $239,000 - $288,000
--
Bed
1
Bath
962
Sq Ft
$274/Sq Ft
Est. Value
About This Home
This home is located at 2325 W Colter St, Phoenix, AZ 85015 and is currently estimated at $263,389, approximately $273 per square foot. 2325 W Colter St is a home located in Maricopa County with nearby schools including Westwood Primary School, Choice Learning Academy, and Central High School.
Ownership History
Date
Name
Owned For
Owner Type
Purchase Details
Closed on
Jul 8, 2025
Sold by
Beasley Shirla Yvonne
Bought by
Beasley Daniel Earl
Current Estimated Value
Purchase Details
Closed on
Jul 26, 2004
Sold by
Schalber Stuart A and Beasley Shirla Yvonne
Bought by
Schalber Stuart A and Beasley Shirla Yvonne
Purchase Details
Closed on
Jan 26, 1999
Sold by
Schalber Stuart A
Bought by
Schalber Stuart A and Beasley Shirla Yvonne
Home Financials for this Owner
Home Financials are based on the most recent Mortgage that was taken out on this home.
Original Mortgage
$63,769
Interest Rate
6.63%
Mortgage Type
FHA
Purchase Details
Closed on
Apr 8, 1997
Sold by
Cummings Therese
Bought by
Schalber Stuart A
Home Financials for this Owner
Home Financials are based on the most recent Mortgage that was taken out on this home.
Original Mortgage
$59,969
Interest Rate
8.14%
Mortgage Type
FHA
Create a Home Valuation Report for This Property
The Home Valuation Report is an in-depth analysis detailing your home's value as well as a comparison with similar homes in the area
Home Values in the Area
Average Home Value in this Area
Purchase History
| Date | Buyer | Sale Price | Title Company |
|---|---|---|---|
| Beasley Daniel Earl | -- | None Listed On Document | |
| Schalber Stuart A | -- | -- | |
| Schalber Stuart A | -- | Nations Title Insurance | |
| Schalber Stuart A | $60,500 | Fidelity Title |
Source: Public Records
Mortgage History
| Date | Status | Borrower | Loan Amount |
|---|---|---|---|
| Previous Owner | Schalber Stuart A | $63,769 | |
| Previous Owner | Schalber Stuart A | $59,969 |
Source: Public Records
Tax History Compared to Growth
Tax History
| Year | Tax Paid | Tax Assessment Tax Assessment Total Assessment is a certain percentage of the fair market value that is determined by local assessors to be the total taxable value of land and additions on the property. | Land | Improvement |
|---|---|---|---|---|
| 2025 | $604 | $4,704 | -- | -- |
| 2024 | $608 | $4,480 | -- | -- |
| 2023 | $608 | $23,520 | $4,700 | $18,820 |
| 2022 | $599 | $16,920 | $3,380 | $13,540 |
| 2021 | $610 | $16,830 | $3,360 | $13,470 |
| 2020 | $585 | $11,520 | $2,300 | $9,220 |
| 2019 | $578 | $8,630 | $1,720 | $6,910 |
| 2018 | $529 | $7,700 | $1,540 | $6,160 |
| 2017 | $523 | $8,400 | $1,680 | $6,720 |
| 2016 | $500 | $7,700 | $1,540 | $6,160 |
| 2015 | $475 | $4,620 | $920 | $3,700 |
Source: Public Records
Map
Nearby Homes
- 5207 N Black Canyon Hwy Unit 18
- 5363 N Black Canyon Hwy
- 5411 N Black Canyon Hwy
- 5425 N Black Canyon Hwy
- 2537 W Georgia Ave Unit 3
- 2537 W Georgia Ave Unit 18
- 2128 W Georgia Ave
- 5202 N 21st Ave
- 2303 W Marshall Ave
- 5020 N 21st Ave Unit 7
- 2106 W Camelback Rd
- 2039 W Pasadena Ave
- 5338 N 21st Ave
- 2027 W Medlock Dr
- 4714 N 23rd Ave
- 2608 W Pierson St
- 5616 N 22nd Dr
- 4701 N 23rd Dr
- 2612 W Pierson St
- 2118 W Elm St
- 2321 W Colter St
- 2329 W Colter St
- 2317 W Colter St
- 2343 W Colter St
- 2345 W Colter St
- 2328 W Orange Dr
- 2336 W Orange Dr
- 2349 W Colter St
- 2313 W Colter St
- 2311 W Colter St
- 2311 W Colter St
- 2322 W Orange Dr
- 2320 W Orange Dr
- 5126 N 24th Ave
- 2314 W Orange Dr
- 2309 W Colter St Unit ID1244326P
- 2309 W Colter St
- 5122 N 24th Ave
- 2333 W Orange Dr
- 2327 W Orange Dr