Estimated Value: $847,000 - $1,122,831
3
Beds
4
Baths
3,425
Sq Ft
$303/Sq Ft
Est. Value
About This Home
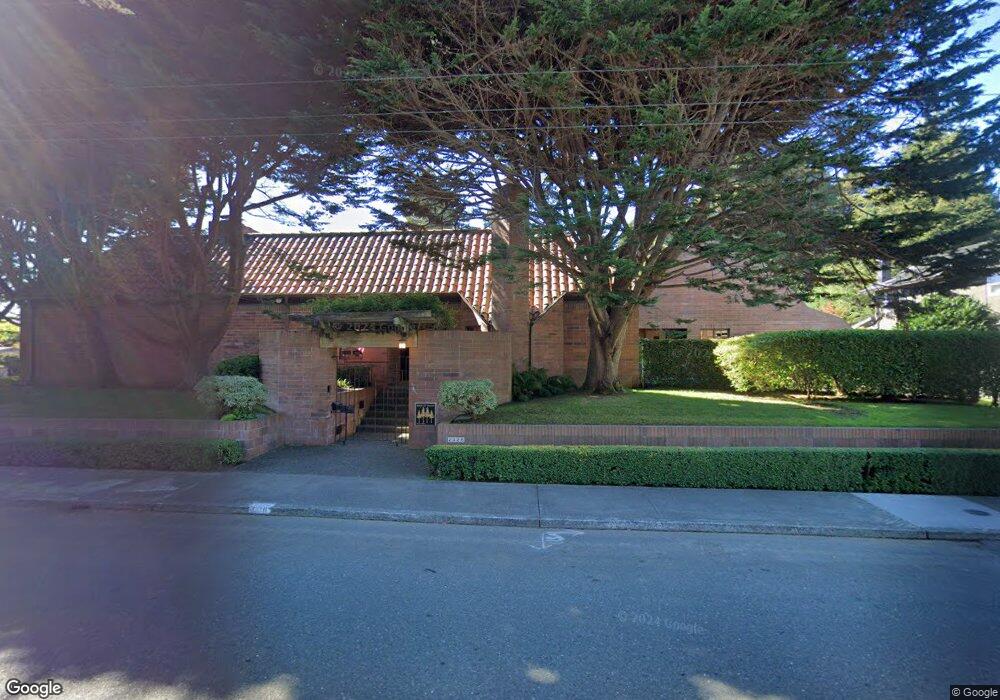
This home is located at 2326 O St, Eureka, CA 95501 and is currently estimated at $1,037,708, approximately $302 per square foot. 2326 O St is a home located in Humboldt County with nearby schools including Washington Elementary School, Catherine L. Zane Middle School, and Eureka Senior High School.
Ownership History
Date
Name
Owned For
Owner Type
Purchase Details
Closed on
Aug 12, 2024
Sold by
Deborah B Storre 2000 Living Trust and Storre Deborah B
Bought by
Jeff And Tonya Pauli 2015 Trust and Pauli
Current Estimated Value
Purchase Details
Closed on
Jul 30, 2020
Sold by
Carlisle Storre Richard
Bought by
Storre Richard C and Storre Deborah B
Purchase Details
Closed on
Jul 27, 2020
Sold by
Storre Richard C and In Deborah
Bought by
Deborah B Storre 2000 Living T
Purchase Details
Closed on
Feb 10, 2004
Sold by
Storre Richard C and Storre Deborah B
Bought by
Storre Richard C and Storre Deborah B
Purchase Details
Closed on
Mar 31, 2000
Sold by
Storre Richard C
Bought by
Storre Richard C and Storre Deborah B
Purchase Details
Closed on
Feb 22, 2000
Sold by
Storre Richard C
Bought by
Storre Richard C
Create a Home Valuation Report for This Property
The Home Valuation Report is an in-depth analysis detailing your home's value as well as a comparison with similar homes in the area
Home Values in the Area
Average Home Value in this Area
Purchase History
| Date | Buyer | Sale Price | Title Company |
|---|---|---|---|
| Jeff And Tonya Pauli 2015 Trust | $1,200,000 | Fidelity National Title Compan | |
| Storre Richard C | -- | -- | |
| Deborah B Storre 2000 Living T | -- | Mitchell Law Firm Llp | |
| Storre Richard C | -- | -- | |
| Storre Richard C | -- | -- | |
| Storre Richard C | -- | -- | |
| Storre Richard C | -- | -- | |
| Storre Richard C | -- | -- |
Source: Public Records
Tax History
| Year | Tax Paid | Tax Assessment Tax Assessment Total Assessment is a certain percentage of the fair market value that is determined by local assessors to be the total taxable value of land and additions on the property. | Land | Improvement |
|---|---|---|---|---|
| 2025 | $6,965 | $684,398 | $123,787 | $560,611 |
| 2024 | $6,965 | $670,979 | $121,360 | $549,619 |
| 2023 | $6,866 | $657,824 | $118,981 | $538,843 |
| 2022 | $7,126 | $644,927 | $116,649 | $528,278 |
| 2021 | $6,672 | $632,282 | $114,362 | $517,920 |
| 2020 | $6,621 | $625,800 | $113,190 | $512,610 |
| 2019 | $6,484 | $613,530 | $110,971 | $502,559 |
| 2018 | $6,385 | $601,501 | $108,796 | $492,705 |
| 2017 | $6,352 | $589,708 | $106,663 | $483,045 |
| 2016 | $6,351 | $578,146 | $104,572 | $473,574 |
| 2015 | $6,294 | $569,463 | $103,002 | $466,461 |
| 2014 | $5,883 | $558,309 | $100,985 | $457,324 |
Source: Public Records
Map
Nearby Homes
Your Personal Tour Guide
Ask me questions while you tour the home.