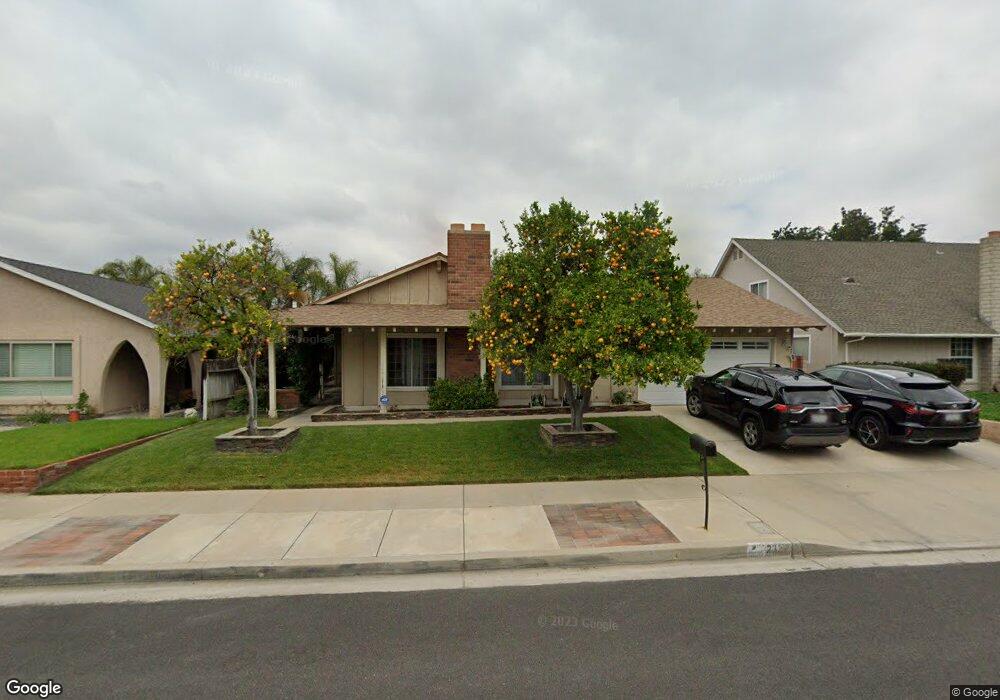
2327 Burnside St Simi Valley, CA 93065
Central Simi Valley NeighborhoodEstimated Value: $805,926 - $887,000
4
Beds
2
Baths
2,015
Sq Ft
$422/Sq Ft
Est. Value
About This Home
This home is located at 2327 Burnside St, Simi Valley, CA 93065 and is currently estimated at $849,482, approximately $421 per square foot. 2327 Burnside St is a home located in Ventura County with nearby schools including Park View Elementary School, Hillside Middle School, and Royal High School.
Ownership History
Date
Name
Owned For
Owner Type
Purchase Details
Closed on
Oct 8, 2003
Sold by
Andrews Cedric E
Bought by
Munoz Jorge and Barron Lorena
Current Estimated Value
Home Financials for this Owner
Home Financials are based on the most recent Mortgage that was taken out on this home.
Original Mortgage
$311,250
Outstanding Balance
$142,952
Interest Rate
5.98%
Mortgage Type
Purchase Money Mortgage
Estimated Equity
$706,530
Purchase Details
Closed on
Sep 6, 1996
Sold by
Andrews Cedric E
Bought by
Andrews Cedric E
Purchase Details
Closed on
Mar 10, 1994
Sold by
Andrews Cedric E and Andrews Eugenia M
Bought by
Andrews Cedric E and Andrews Eugenia M
Create a Home Valuation Report for This Property
The Home Valuation Report is an in-depth analysis detailing your home's value as well as a comparison with similar homes in the area
Home Values in the Area
Average Home Value in this Area
Purchase History
| Date | Buyer | Sale Price | Title Company |
|---|---|---|---|
| Munoz Jorge | $415,000 | -- | |
| Andrews Cedric E | -- | -- | |
| Andrews Cedric E | -- | -- |
Source: Public Records
Mortgage History
| Date | Status | Borrower | Loan Amount |
|---|---|---|---|
| Open | Munoz Jorge | $311,250 | |
| Closed | Munoz Jorge | $83,000 |
Source: Public Records
Tax History
| Year | Tax Paid | Tax Assessment Tax Assessment Total Assessment is a certain percentage of the fair market value that is determined by local assessors to be the total taxable value of land and additions on the property. | Land | Improvement |
|---|---|---|---|---|
| 2025 | $7,080 | $590,029 | $295,016 | $295,013 |
| 2024 | $7,080 | $578,460 | $289,231 | $289,229 |
| 2023 | $6,657 | $567,118 | $283,560 | $283,558 |
| 2022 | $6,638 | $555,999 | $278,000 | $277,999 |
| 2021 | $6,596 | $545,098 | $272,549 | $272,549 |
| 2020 | $6,464 | $539,510 | $269,755 | $269,755 |
| 2019 | $13,110 | $528,932 | $264,466 | $264,466 |
| 2018 | $13,058 | $518,562 | $259,281 | $259,281 |
| 2017 | $12,905 | $508,396 | $254,198 | $254,198 |
| 2016 | $5,722 | $498,428 | $249,214 | $249,214 |
| 2015 | $5,605 | $490,942 | $245,471 | $245,471 |
| 2014 | $5,531 | $481,326 | $240,663 | $240,663 |
Source: Public Records
Map
Nearby Homes
- 2371 Larch St
- 2399 Lee St
- 2405 Lee St
- 1954 Claudia Ave
- 2146 N Brower St
- 1843 Garvin Ave
- 2357 Lawnview Ct
- 2325 Wisteria St
- 2239 McDonald St
- 2293 Lupin St
- 2410 N Justin Ave
- 2235 Clover St
- 2133 Cochran St
- 2091 Marter Ave
- 1558 Ysrella Ave
- 2165 Malcolm St
- 2002 Malcolm St
- 2516 E Phyllis St
- 2407 Elizondo Ave
- 2095 Morley St
- 2339 Burnside St
- 2323 Burnside St
- 2328 Knollhaven St
- 2332 Knollhaven St
- 2324 Knollhaven St
- 2317 Burnside St
- 2347 Burnside St
- 2326 Burnside St
- 2348 Knollhaven St
- 2318 Knollhaven St
- 2320 Burnside St
- 2338 Burnside St
- 2305 Burnside St
- 2353 Burnside St
- 2346 Burnside St
- 2316 Burnside St
- 2306 Knollhaven St
- 2354 Knollhaven St
- 2352 Burnside St
- 2304 Burnside St
Your Personal Tour Guide
Ask me questions while you tour the home.