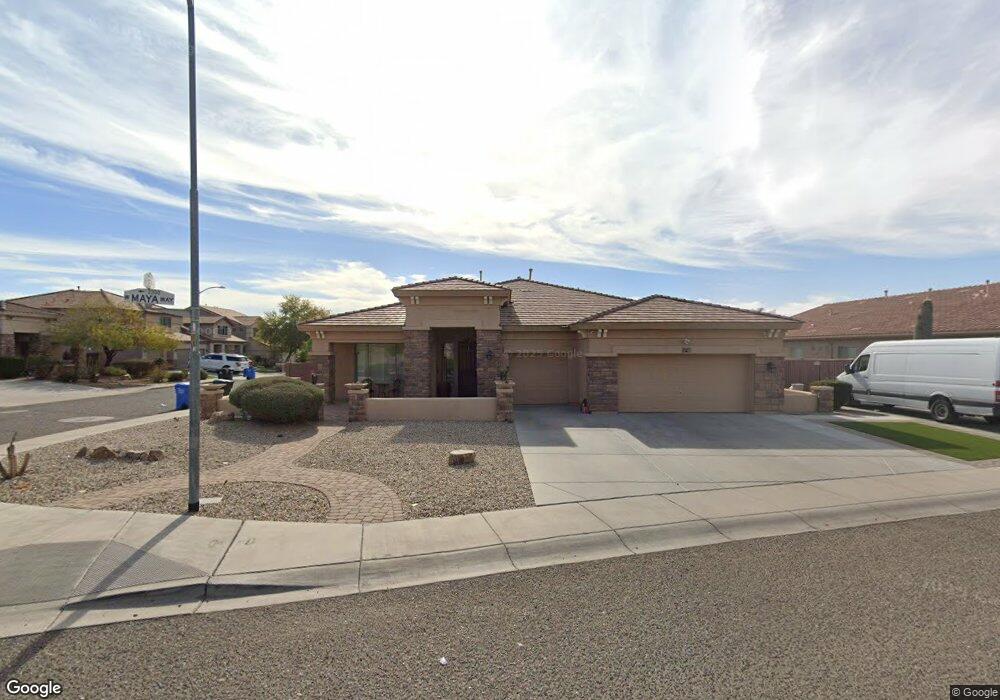
2327 W Maya Way Phoenix, AZ 85085
Norterra NeighborhoodEstimated Value: $781,503 - $898,000
--
Bed
4
Baths
2,903
Sq Ft
$284/Sq Ft
Est. Value
About This Home
This home is located at 2327 W Maya Way, Phoenix, AZ 85085 and is currently estimated at $824,126, approximately $283 per square foot. 2327 W Maya Way is a home located in Maricopa County with nearby schools including Norterra Canyon School, Barry Goldwater High School, and Adams Traditional Academy.
Ownership History
Date
Name
Owned For
Owner Type
Purchase Details
Closed on
Dec 19, 2011
Sold by
Pursell Jerry and Pursell Anna
Bought by
Sarkisyan Lusine
Current Estimated Value
Purchase Details
Closed on
Dec 13, 2011
Sold by
Gale Patricia L and Gale Mark T
Bought by
Pursell Jerry and Pursell Anna
Purchase Details
Closed on
Mar 23, 2006
Sold by
Meritage Homes Of Arizona Inc
Bought by
Gale Mark T and Gale Patricia L
Home Financials for this Owner
Home Financials are based on the most recent Mortgage that was taken out on this home.
Original Mortgage
$393,200
Interest Rate
6.25%
Mortgage Type
New Conventional
Create a Home Valuation Report for This Property
The Home Valuation Report is an in-depth analysis detailing your home's value as well as a comparison with similar homes in the area
Home Values in the Area
Average Home Value in this Area
Purchase History
| Date | Buyer | Sale Price | Title Company |
|---|---|---|---|
| Sarkisyan Lusine | $287,500 | First American Title Ins Co | |
| Pursell Jerry | $251,200 | None Available | |
| Gale Mark T | $491,512 | First American Title Ins Co |
Source: Public Records
Mortgage History
| Date | Status | Borrower | Loan Amount |
|---|---|---|---|
| Previous Owner | Gale Mark T | $393,200 |
Source: Public Records
Tax History Compared to Growth
Tax History
| Year | Tax Paid | Tax Assessment Tax Assessment Total Assessment is a certain percentage of the fair market value that is determined by local assessors to be the total taxable value of land and additions on the property. | Land | Improvement |
|---|---|---|---|---|
| 2025 | $4,024 | $45,078 | -- | -- |
| 2024 | $3,891 | $42,931 | -- | -- |
| 2023 | $3,891 | $58,080 | $11,610 | $46,470 |
| 2022 | $3,740 | $44,050 | $8,810 | $35,240 |
| 2021 | $3,856 | $41,100 | $8,220 | $32,880 |
| 2020 | $3,778 | $38,570 | $7,710 | $30,860 |
| 2019 | $3,652 | $37,930 | $7,580 | $30,350 |
| 2018 | $3,523 | $36,010 | $7,200 | $28,810 |
| 2017 | $3,402 | $33,570 | $6,710 | $26,860 |
| 2016 | $3,210 | $31,870 | $6,370 | $25,500 |
| 2015 | $2,866 | $30,610 | $6,120 | $24,490 |
Source: Public Records
Map
Nearby Homes
- 2332 W Andrea Dr
- 26706 N 24th Dr
- 2442 W Rowel Rd
- 2460 W Rowel Rd
- 2482 W Rowel Rd
- 26433 N 22nd Dr
- 26429 N 22nd Dr
- 2488 W Rowel Rd
- 27414 N 22nd Ln
- 26421 N 22nd Dr
- 2452 W Maximo Way
- 2438 W Maximo Way
- 2454 W Maximo Way
- 2440 W Maximo Way
- 2448 W Maximo Way
- 2458 W Maximo Way
- 2443 W Maximo Way
- 26330 N 24th Glen
- 2453 W Maximo Way
- 2445 W Maximo Way
- 2331 W Maya Way
- 2324 W Blaylock Dr
- 2328 W Blaylock Dr
- 26915 N 23rd Ln
- 2335 W Maya Way
- 26911 N 23rd Ln
- 26919 N 23rd Ln
- 2330 W Maya Way
- 2332 W Blaylock Dr
- 2334 W Maya Way
- 26907 N 23rd Ln
- 2326 W Maya Way
- 2339 W Maya Way
- 2338 W Maya Way
- 2336 W Blaylock Dr
- 26903 N 23rd Ln
- 2322 W Maya Way
- 27002 N 23rd Dr
- 27006 N 23rd Dr
- 2340 W Blaylock Dr