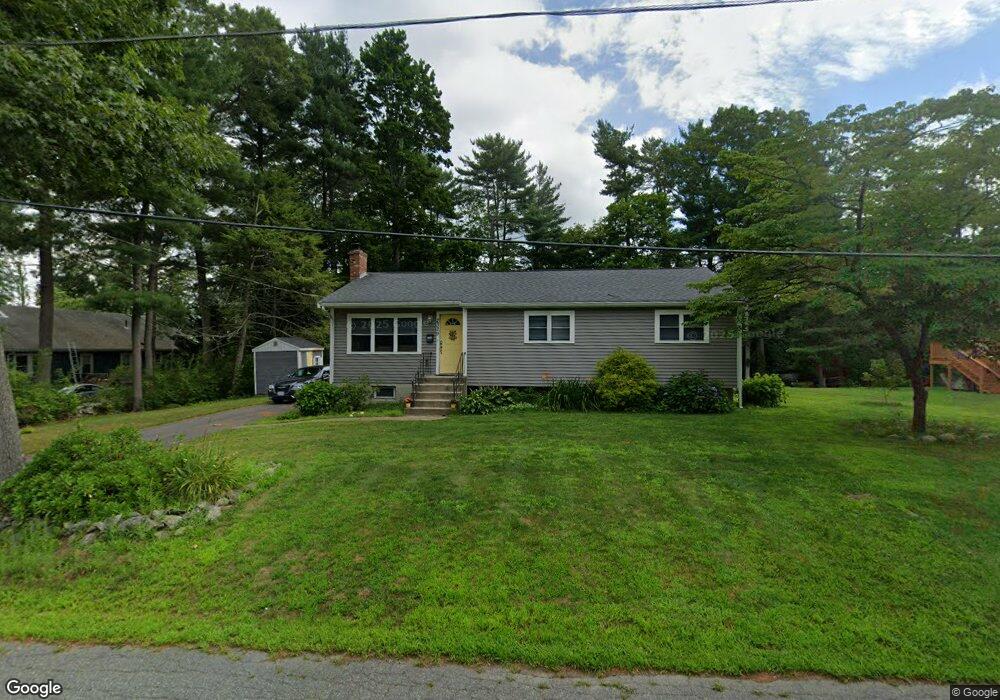
2329 Central St Stoughton, MA 02072
Estimated Value: $529,000 - $626,000
3
Beds
1
Bath
1,543
Sq Ft
$377/Sq Ft
Est. Value
About This Home
This home is located at 2329 Central St, Stoughton, MA 02072 and is currently estimated at $581,010, approximately $376 per square foot. 2329 Central St is a home located in Norfolk County with nearby schools including Helen Hansen Elementary School, O'Donnell Middle School, and Stoughton High School.
Ownership History
Date
Name
Owned For
Owner Type
Purchase Details
Closed on
Jan 12, 2023
Sold by
Mahan William F and Mahan Lauren K
Bought by
Mahan William F and Mahan Lauren K
Current Estimated Value
Purchase Details
Closed on
Aug 29, 2016
Sold by
Fitzsimons Dev Corp
Bought by
Mahan William F and Mahan Lauren K
Purchase Details
Closed on
May 2, 2016
Sold by
Noveletsky Neil W and Noveletsky Jeffrey M
Bought by
Fitzsimons Dev Corp
Purchase Details
Closed on
Aug 31, 2004
Sold by
Wittenberg Mildred and Noveletsky Neil W
Bought by
Noveletsky Jeffrey M and Noveletsky Neil W
Purchase Details
Closed on
Oct 23, 1974
Bought by
Noveletsky Neil M and Noveletsky Jeffrey M
Create a Home Valuation Report for This Property
The Home Valuation Report is an in-depth analysis detailing your home's value as well as a comparison with similar homes in the area
Home Values in the Area
Average Home Value in this Area
Purchase History
| Date | Buyer | Sale Price | Title Company |
|---|---|---|---|
| Mahan William F | -- | None Available | |
| Mahan William F | -- | None Available | |
| Mahan William F | -- | None Available | |
| Mahan William F | $329,000 | -- | |
| Mahan William F | $329,000 | -- | |
| Mahan William F | $329,000 | -- | |
| Fitzsimons Dev Corp | $116,000 | -- | |
| Fitzsimons Dev Corp | $116,000 | -- | |
| Fitzsimons Dev Corp | $116,000 | -- | |
| Noveletsky Jeffrey M | -- | -- | |
| Noveletsky Jeffrey M | -- | -- | |
| Noveletsky Neil M | -- | -- |
Source: Public Records
Tax History
| Year | Tax Paid | Tax Assessment Tax Assessment Total Assessment is a certain percentage of the fair market value that is determined by local assessors to be the total taxable value of land and additions on the property. | Land | Improvement |
|---|---|---|---|---|
| 2025 | $5,539 | $447,400 | $203,100 | $244,300 |
| 2024 | $5,437 | $427,100 | $185,600 | $241,500 |
| 2023 | $5,257 | $388,000 | $171,600 | $216,400 |
| 2022 | $5,015 | $348,000 | $157,600 | $190,400 |
| 2021 | $4,720 | $312,600 | $134,800 | $177,800 |
| 2020 | $4,577 | $307,400 | $129,600 | $177,800 |
| 2019 | $4,495 | $293,000 | $129,600 | $163,400 |
| 2018 | $3,962 | $267,500 | $122,600 | $144,900 |
| 2017 | $3,524 | $243,200 | $110,300 | $132,900 |
| 2016 | $3,406 | $227,500 | $108,600 | $118,900 |
| 2015 | $3,283 | $217,000 | $98,100 | $118,900 |
| 2014 | $3,068 | $194,900 | $91,100 | $103,800 |
Source: Public Records
Map
Nearby Homes
- 25 Bayberry Dr Unit 1
- 42 Bayberry Dr Unit 1
- 2196 Central St
- 55 Brian Dr Unit G
- 90 Charles Cir
- 12 Eastwood Rd
- 20 Dunbar St
- 7 Belcher St
- 36 Jessica Dr Unit H
- 6 Jessica Dr Unit E
- 52 Edward Dr Unit 52
- 329 N Main St
- 84 Kim Terrace
- 72 Copperwood Dr
- 34 Copperwood Dr Unit 34
- 109 Greenbrook Dr Unit 109
- 95 Greenbrook Dr Unit A95
- 49 Elderwood Dr Unit 49
- 353 Washington St
- 85 Rosewood Dr Unit 28-1
Your Personal Tour Guide
Ask me questions while you tour the home.