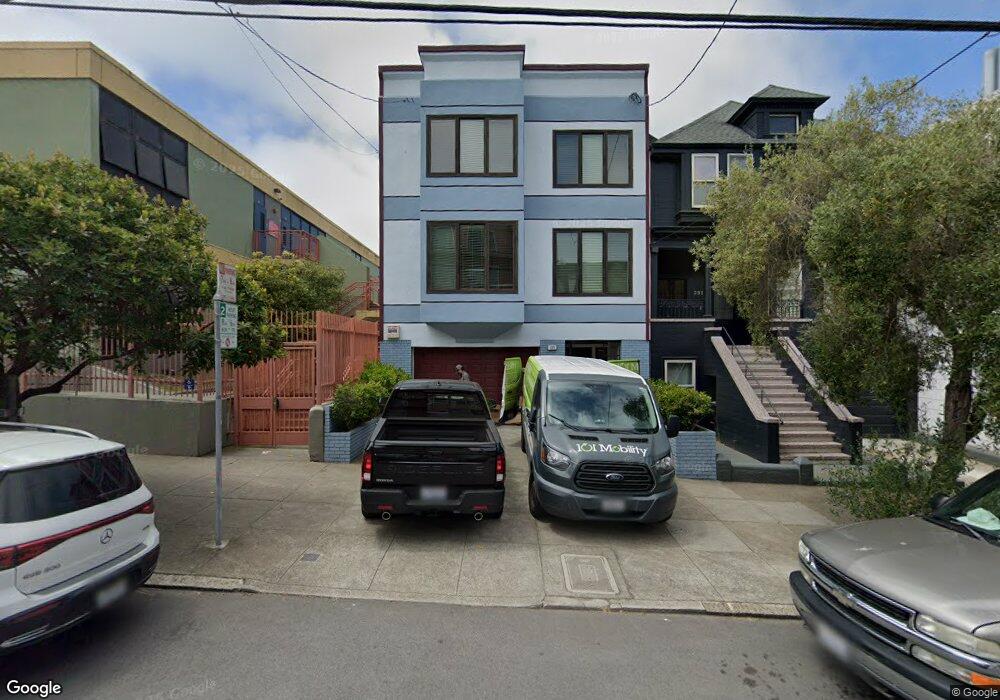
233 12th Ave San Francisco, CA 94118
Inner Richmond NeighborhoodEstimated Value: $2,895,000 - $3,511,000
4
Beds
6
Baths
2,800
Sq Ft
$1,123/Sq Ft
Est. Value
About This Home
This home is located at 233 12th Ave, San Francisco, CA 94118 and is currently estimated at $3,144,669, approximately $1,123 per square foot. 233 12th Ave is a home located in San Francisco County with nearby schools including Sutro Elementary School, Roosevelt Middle School, and Stratford School - San Francisco 14th Avenue.
Ownership History
Date
Name
Owned For
Owner Type
Purchase Details
Closed on
Oct 2, 2020
Sold by
Lee Winfield and Lee Debbie
Bought by
Lee Winfield and Lee Debbie
Current Estimated Value
Home Financials for this Owner
Home Financials are based on the most recent Mortgage that was taken out on this home.
Original Mortgage
$480,000
Interest Rate
2.9%
Mortgage Type
New Conventional
Purchase Details
Closed on
Oct 10, 2012
Sold by
Lee Winfield and Lee Debbie N
Bought by
Lee Winfield and Lee Debbie
Home Financials for this Owner
Home Financials are based on the most recent Mortgage that was taken out on this home.
Original Mortgage
$625,500
Interest Rate
3.52%
Mortgage Type
New Conventional
Purchase Details
Closed on
May 31, 2000
Sold by
Winfield Lee
Bought by
Lee Winfield and Lee Debbie
Create a Home Valuation Report for This Property
The Home Valuation Report is an in-depth analysis detailing your home's value as well as a comparison with similar homes in the area
Home Values in the Area
Average Home Value in this Area
Purchase History
| Date | Buyer | Sale Price | Title Company |
|---|---|---|---|
| Lee Winfield | -- | Chicago Title Company | |
| Lee Winfield | -- | Chicago Title Company | |
| Lee Winfield | -- | Chicago Title Company | |
| Lee Winfield | -- | Chicago Title Company | |
| Lee Winfield | -- | -- |
Source: Public Records
Mortgage History
| Date | Status | Borrower | Loan Amount |
|---|---|---|---|
| Closed | Lee Winfield | $480,000 | |
| Closed | Lee Winfield | $625,500 |
Source: Public Records
Tax History Compared to Growth
Tax History
| Year | Tax Paid | Tax Assessment Tax Assessment Total Assessment is a certain percentage of the fair market value that is determined by local assessors to be the total taxable value of land and additions on the property. | Land | Improvement |
|---|---|---|---|---|
| 2025 | $12,717 | $1,104,765 | $469,140 | $635,625 |
| 2024 | $12,717 | $1,083,104 | $459,942 | $623,162 |
| 2023 | $12,534 | $1,061,868 | $450,924 | $610,944 |
| 2022 | $12,310 | $1,041,048 | $442,083 | $598,965 |
| 2021 | $12,097 | $1,020,636 | $433,415 | $587,221 |
| 2020 | $12,134 | $1,010,171 | $428,971 | $581,200 |
| 2019 | $11,716 | $990,364 | $420,560 | $569,804 |
| 2018 | $11,322 | $970,946 | $412,314 | $558,632 |
| 2017 | $11,188 | $951,909 | $404,230 | $547,679 |
| 2016 | $11,001 | $933,245 | $396,304 | $536,941 |
| 2015 | $10,867 | $919,228 | $390,352 | $528,876 |
| 2014 | $10,580 | $901,223 | $382,706 | $518,517 |
Source: Public Records
Map
Nearby Homes
- 231 12th Ave
- 223 12th Ave Unit 225
- 219 12th Ave Unit 221
- 224 Funston Ave
- 222 Funston Ave
- 5033 California St Unit 5035
- 230 12th Ave
- 218 Funston Ave Unit 220
- 226 12th Ave
- 5045 California St
- 214 Funston Ave
- 5041 California St Unit 5041
- 237 12th Ave Unit 239
- 218 12th Ave Unit 220
- 242 12th Ave Unit 244
- 208 12th Ave
- 210 12th Ave
- 4945 California St
- 200 Funston Ave
- 200 Funston Ave Unit 204