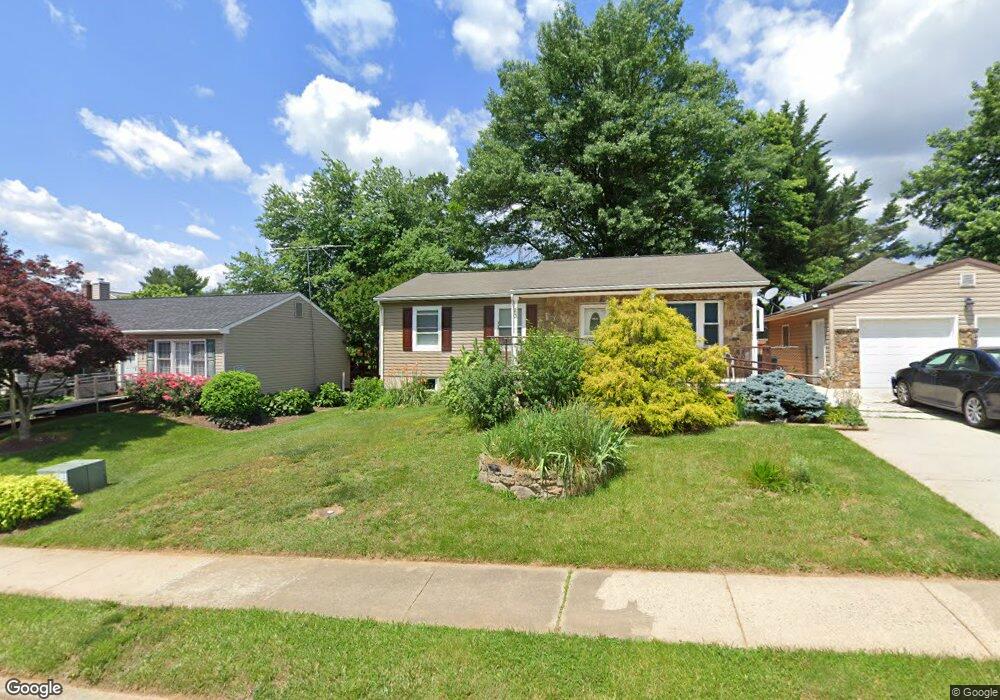
233 13th Ave Brunswick, MD 21716
Estimated Value: $316,000 - $362,069
Studio
3
Baths
1,292
Sq Ft
$264/Sq Ft
Est. Value
About This Home
This home is located at 233 13th Ave, Brunswick, MD 21716 and is currently estimated at $341,267, approximately $264 per square foot. 233 13th Ave is a home located in Frederick County with nearby schools including Brunswick Elementary School, Brunswick Middle School, and Brunswick High School.
Ownership History
Date
Name
Owned For
Owner Type
Purchase Details
Closed on
Sep 13, 2005
Sold by
Grimes Patrick W
Bought by
Grimes Patrick W and Grimes Patricia
Current Estimated Value
Home Financials for this Owner
Home Financials are based on the most recent Mortgage that was taken out on this home.
Original Mortgage
$165,000
Outstanding Balance
$87,942
Interest Rate
5.79%
Mortgage Type
New Conventional
Estimated Equity
$253,325
Purchase Details
Closed on
Jan 11, 1993
Sold by
Grimes Douglas L
Bought by
Grimes Patrick W
Home Financials for this Owner
Home Financials are based on the most recent Mortgage that was taken out on this home.
Original Mortgage
$104,000
Interest Rate
8.07%
Purchase Details
Closed on
May 7, 1986
Sold by
Makela Corp
Bought by
Grimes Douglas L
Home Financials for this Owner
Home Financials are based on the most recent Mortgage that was taken out on this home.
Original Mortgage
$69,550
Interest Rate
9.9%
Create a Home Valuation Report for This Property
The Home Valuation Report is an in-depth analysis detailing your home's value as well as a comparison with similar homes in the area
Home Values in the Area
Average Home Value in this Area
Purchase History
| Date | Buyer | Sale Price | Title Company |
|---|---|---|---|
| Grimes Patrick W | -- | -- | |
| Grimes Patrick W | $100,000 | -- | |
| Grimes Douglas L | $68,000 | -- |
Source: Public Records
Mortgage History
| Date | Status | Borrower | Loan Amount |
|---|---|---|---|
| Open | Grimes Patrick W | $165,000 | |
| Previous Owner | Grimes Patrick W | $104,000 | |
| Previous Owner | Grimes Douglas L | $69,550 |
Source: Public Records
Tax History
| Year | Tax Paid | Tax Assessment Tax Assessment Total Assessment is a certain percentage of the fair market value that is determined by local assessors to be the total taxable value of land and additions on the property. | Land | Improvement |
|---|---|---|---|---|
| 2025 | $4,171 | $277,333 | -- | -- |
| 2024 | $4,171 | $253,200 | $86,700 | $166,500 |
| 2023 | $3,876 | $242,333 | $0 | $0 |
| 2022 | $3,706 | $231,467 | $0 | $0 |
| 2021 | $3,339 | $220,600 | $61,900 | $158,700 |
| 2020 | $3,339 | $208,000 | $0 | $0 |
| 2019 | $3,143 | $195,400 | $0 | $0 |
| 2018 | $2,998 | $182,800 | $49,500 | $133,300 |
| 2017 | $2,971 | $182,800 | $0 | $0 |
| 2016 | $88 | $181,467 | $0 | $0 |
| 2015 | $88 | $180,800 | $0 | $0 |
| 2014 | $88 | $180,800 | $0 | $0 |
Source: Public Records
Map
Nearby Homes
- 222 Cummings Dr
- 231 13th Ave
- 220 Cummings Dr
- 225 Tamarack Way
- 221 Tamarack Way
- 218 Cummings Dr
- 219 Tamarack Way
- 216 Cummings Dr
- 217 Tamarack Way
- 224 Tamarack Way
- 222 Tamarack Way
- 210 13th Ave
- 214 Cummings Dr
- 220 Tamarack Way
- 218 Tamarack Way
- 215 Tamarack Way
- 223 13th Ave
- 212 Cummings Dr
- 216 Tamarack Way
- 213 Tamarack Way
Your Personal Tour Guide
Ask me questions while you tour the home.