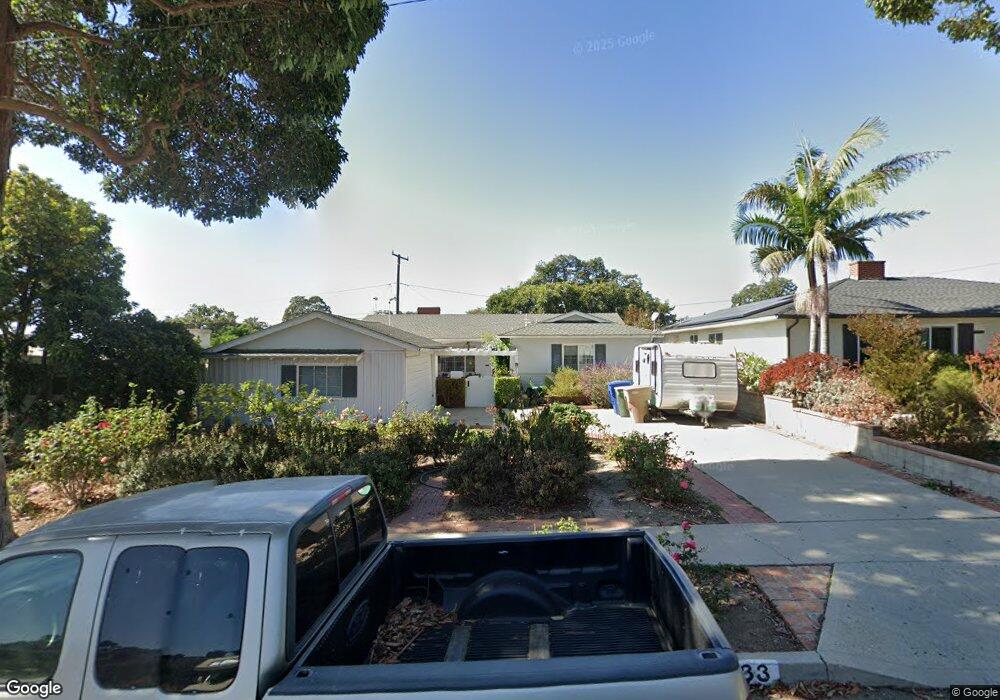
233 Dorothy Ave Ventura, CA 93003
College NeighborhoodEstimated Value: $908,000 - $1,536,000
3
Beds
2
Baths
1,600
Sq Ft
$723/Sq Ft
Est. Value
About This Home
This home is located at 233 Dorothy Ave, Ventura, CA 93003 and is currently estimated at $1,156,392, approximately $722 per square foot. 233 Dorothy Ave is a home located in Ventura County with nearby schools including Loma Vista Elementary School, Cabrillo Middle School, and Ventura High School.
Ownership History
Date
Name
Owned For
Owner Type
Purchase Details
Closed on
Jan 28, 2013
Sold by
Huff Richard L and Huff Jobyna Cummins
Bought by
Huff Richard L and Huff Jobyna C
Current Estimated Value
Home Financials for this Owner
Home Financials are based on the most recent Mortgage that was taken out on this home.
Original Mortgage
$360,000
Outstanding Balance
$250,727
Interest Rate
3.33%
Mortgage Type
New Conventional
Estimated Equity
$905,665
Purchase Details
Closed on
Jul 7, 2006
Sold by
Huff Richard L and Huff Jobyna Cummins
Bought by
Huff Richard L and Huff Jobyna C
Purchase Details
Closed on
Nov 9, 2004
Sold by
Huff Richard L and Huff Jobyna Cummins
Bought by
Huff Richard L and Huff Jobyna Cummins
Home Financials for this Owner
Home Financials are based on the most recent Mortgage that was taken out on this home.
Original Mortgage
$304,567
Interest Rate
5.79%
Mortgage Type
New Conventional
Create a Home Valuation Report for This Property
The Home Valuation Report is an in-depth analysis detailing your home's value as well as a comparison with similar homes in the area
Home Values in the Area
Average Home Value in this Area
Purchase History
| Date | Buyer | Sale Price | Title Company |
|---|---|---|---|
| Huff Richard L | -- | First American Title Company | |
| Huff Richard L | -- | First American Title Company | |
| Huff Richard L | -- | None Available | |
| Huff Richard L | -- | Old Republic Title Company |
Source: Public Records
Mortgage History
| Date | Status | Borrower | Loan Amount |
|---|---|---|---|
| Open | Huff Richard L | $360,000 | |
| Closed | Huff Richard L | $304,567 |
Source: Public Records
Tax History Compared to Growth
Tax History
| Year | Tax Paid | Tax Assessment Tax Assessment Total Assessment is a certain percentage of the fair market value that is determined by local assessors to be the total taxable value of land and additions on the property. | Land | Improvement |
|---|---|---|---|---|
| 2025 | $1,485 | $135,286 | $26,980 | $108,306 |
| 2024 | $1,485 | $132,634 | $26,451 | $106,183 |
| 2023 | $1,468 | $130,034 | $25,933 | $104,101 |
| 2022 | $1,370 | $127,485 | $25,425 | $102,060 |
| 2021 | $1,347 | $124,986 | $24,927 | $100,059 |
| 2020 | $1,335 | $123,706 | $24,672 | $99,034 |
| 2019 | $1,311 | $121,282 | $24,189 | $97,093 |
| 2018 | $1,289 | $118,905 | $23,715 | $95,190 |
| 2017 | $1,266 | $116,574 | $23,250 | $93,324 |
| 2016 | $1,244 | $114,290 | $22,795 | $91,495 |
| 2015 | $1,224 | $112,575 | $22,453 | $90,122 |
| 2014 | $1,207 | $110,371 | $22,014 | $88,357 |
Source: Public Records
Map
Nearby Homes
- 251 Palomares Ave
- 3750 Mound Ave
- 33 Glen Ellen Dr
- 114 San Marino Ave
- 4205 Foothill Rd
- 3302 San Luis St
- 109 S Dunning St
- 3124 Grove St
- 4432 Westmont St
- 4797 Loma Vista Rd
- 3700 Dean Dr Unit 1101
- 3700 Dean Dr Unit 2106
- 3700 Dean Dr Unit 302
- 3700 Dean Dr Unit 1207
- 3179 Porter Ln
- 4857 Loma Vista Rd
- 3353 Porter Ln
- 3345 Porter Ln
- 4700 Aurora Dr Unit 16
- 4700 Aurora Dr Unit 75
- 225 Dorothy Ave
- 241 Dorothy Ave
- 217 Dorothy Ave
- 249 Dorothy Ave
- 234 Palomares Ave
- 242 Palomares Ave
- 226 Palomares Ave
- 250 Palomares Ave
- 218 Palomares Ave
- 232 Dorothy Ave
- 257 Dorothy Ave
- 224 Dorothy Ave
- 240 Dorothy Ave
- 216 Dorothy Ave
- 242 Dorothy Ave
- 258 Palomares Ave
- 210 Palomares Ave
- 3845 Loma Vista Rd
- 265 Dorothy Ave
- 208 Dorothy Ave