233 E 7th St Hanford, CA 93230
Estimated payment $1,841/month
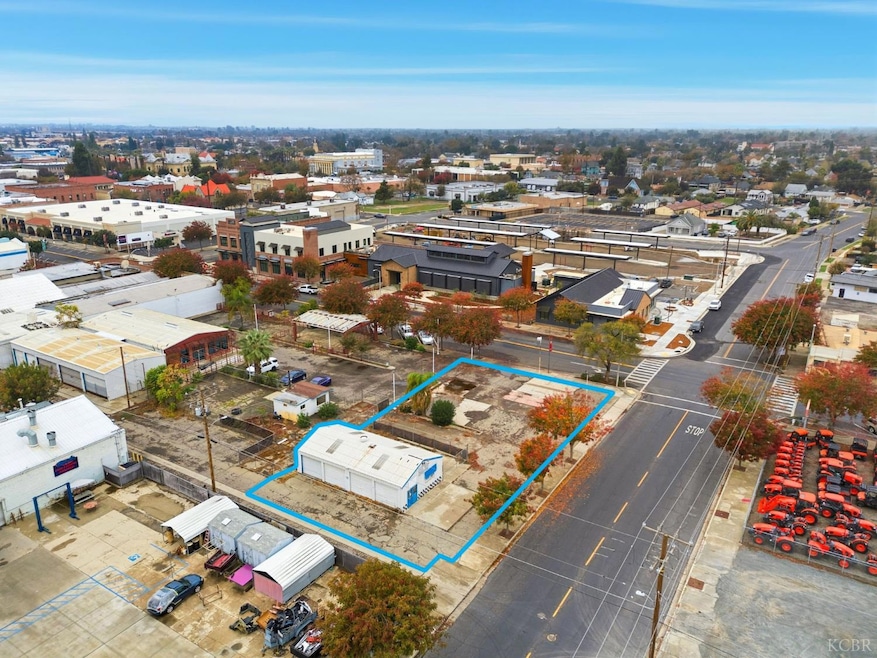
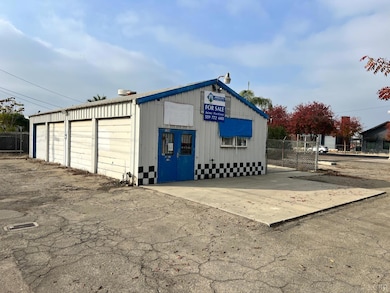
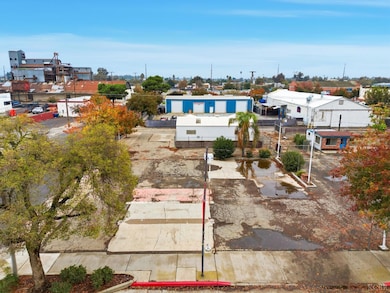
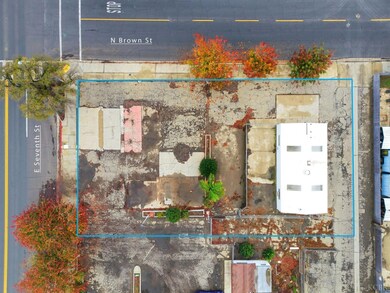
About This Lot
Corner lot with frontage on 7th St and Brown street. 11,260 SF parcel with a +/-1,000 SF metal shop building, previously a mechanic shop. Includes a small interior office and alley access. Zoned for mixed-use in downtown Hanford, offering multiple potential uses. Suitable for owner-users or investors purchasing to lease the property to an operator. Buyer to verify building size, use applications, and property lot lines with the City of Hanford. Parcel outlines are approximate. Contact for further details.
Listing Agent
Jaime Martinez
Hoekstra & Associates Inc License #01971583 Listed on: 12/02/2025
Property Details
Property Type
- Land
Lot Details
- 0.26 Acre Lot
- Corner Lot
- Property is zoned MX-D
Community Details
- No Home Owners Association
Listing and Financial Details
- Assessor Parcel Number 012045005000
Map
Home Values in the Area
Average Home Value in this Area
Property History
| Date | Event | Price | List to Sale | Price per Sq Ft |
|---|---|---|---|---|
| 12/02/2025 12/02/25 | For Sale | $300,000 | -- | -- |
Purchase History
| Date | Type | Sale Price | Title Company |
|---|---|---|---|
| Grant Deed | $1,300,000 | Chicago Title Company | |
| Grant Deed | -- | Chicago Title Co |
Mortgage History
| Date | Status | Loan Amount | Loan Type |
|---|---|---|---|
| Previous Owner | $800,000 | Commercial | |
| Closed | $946,000 | No Value Available |
Source: Kings County Board of REALTORS®
MLS Number: 233257
APN: 012-045-005-000
- 616 S Irwin St Unit C
- 910 Kaweah St
- 130 E Malone St
- 536 E Grangeville Blvd
- 1408 Rodgers Rd
- 1412 Rodgers Rd
- 1973 Emma Lee Ln
- 1985 Lynn Ln
- 1772 Woodland Dr
- 1850 Centennial Dr
- 12642 Hanford Armona Rd
- 575 W Cinnamon Ave
- 2093 Cortner St
- 10842 Railroad Ave Unit D
- 1046 Lords Ct
- 1165 E Hanford Armona Rd
- 550 E Hanford Armona Rd
- 1169 Beverly Dr
- 265 E Hanford Armona Rd
- 1040 Blake St

Ask me questions while you tour the home.