Estimated Value: $260,000 - $362,000
2
Beds
2
Baths
1,150
Sq Ft
$255/Sq Ft
Est. Value
About This Home
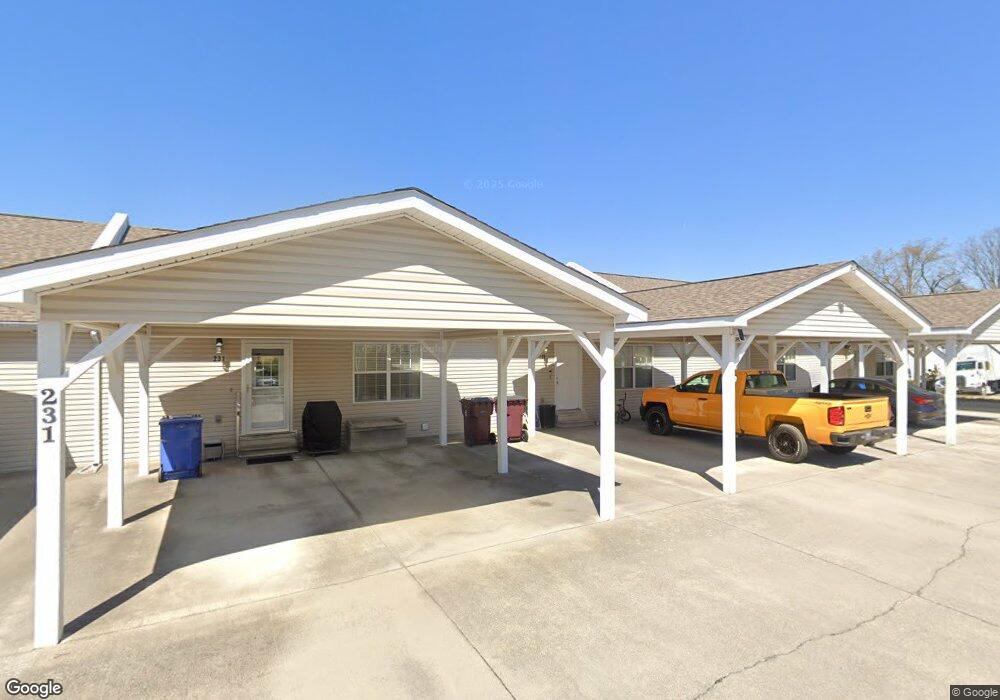
This home is located at 233 Olympia Dr Unit 2, Alcoa, TN 37701 and is currently estimated at $293,209, approximately $254 per square foot. 233 Olympia Dr Unit 2 is a home located in Blount County with nearby schools including Alcoa Elementary School, Alcoa Middle School, and Alcoa High School.
Ownership History
Date
Name
Owned For
Owner Type
Purchase Details
Closed on
Jun 6, 2022
Sold by
Dewayne Walker Devin
Bought by
Dennis W Weeter Trust
Current Estimated Value
Purchase Details
Closed on
Aug 27, 2021
Sold by
Simerly Ledford Lewis
Bought by
Walker Devin Dewayne
Home Financials for this Owner
Home Financials are based on the most recent Mortgage that was taken out on this home.
Original Mortgage
$118,915
Interest Rate
2.8%
Mortgage Type
New Conventional
Purchase Details
Closed on
Oct 30, 2019
Sold by
Simerly Sherri Lynn
Bought by
Simerly Ledford L
Purchase Details
Closed on
Apr 29, 2011
Sold by
Branch Banking & Trust
Bought by
Large Sherri L
Home Financials for this Owner
Home Financials are based on the most recent Mortgage that was taken out on this home.
Original Mortgage
$50,000
Interest Rate
4.85%
Mortgage Type
Commercial
Purchase Details
Closed on
Nov 19, 2010
Sold by
Price Dwight
Bought by
Branch Banking
Create a Home Valuation Report for This Property
The Home Valuation Report is an in-depth analysis detailing your home's value as well as a comparison with similar homes in the area
Home Values in the Area
Average Home Value in this Area
Purchase History
| Date | Buyer | Sale Price | Title Company |
|---|---|---|---|
| Dennis W Weeter Trust | $255,000 | New Title Company Name | |
| Walker Devin Dewayne | $139,900 | -- | |
| Simerly Ledford L | $93,633 | -- | |
| Large Sherri L | $125,000 | -- | |
| Branch Banking | $118,762 | -- |
Source: Public Records
Mortgage History
| Date | Status | Borrower | Loan Amount |
|---|---|---|---|
| Previous Owner | Walker Devin Dewayne | $118,915 | |
| Previous Owner | Large Sherri L | $50,000 |
Source: Public Records
Tax History Compared to Growth
Tax History
| Year | Tax Paid | Tax Assessment Tax Assessment Total Assessment is a certain percentage of the fair market value that is determined by local assessors to be the total taxable value of land and additions on the property. | Land | Improvement |
|---|---|---|---|---|
| 2024 | $1,912 | $58,300 | $12,500 | $45,800 |
| 2023 | $1,912 | $58,300 | $12,500 | $45,800 |
| 2022 | $1,673 | $35,300 | $5,000 | $30,300 |
| 2021 | $1,673 | $35,300 | $5,000 | $30,300 |
| 2020 | $1,673 | $35,300 | $5,000 | $30,300 |
| 2019 | $1,673 | $35,300 | $5,000 | $30,300 |
| 2018 | $1,377 | $31,075 | $4,500 | $26,575 |
| 2017 | $1,377 | $31,075 | $4,500 | $26,575 |
| 2016 | $1,377 | $31,075 | $4,500 | $26,575 |
| 2015 | $1,277 | $31,075 | $4,500 | $26,575 |
| 2014 | $1,393 | $31,075 | $4,500 | $26,575 |
| 2013 | $1,393 | $33,900 | $0 | $0 |
Source: Public Records
Map
Nearby Homes
- 233 Olympia Dr
- 227 Gill St
- 111 Regal Tower
- 106 Regal Tower
- 110 Regal Tower
- 0 Hannum St
- 607 Regal Tower
- 124 Olympia Dr
- 255 Sanderson St
- 250 S Rankin Rd
- 239 Lindsay St
- 450 E Church Ave
- 161 E Harper Ave
- 275 Glascock St
- 135 E Harper Ave
- 410 E Church Ave
- 404 E Church Ave
- 408 E Church Ave
- 125 E Harper Ave
- 252 Glascock St
- 235 Olympia Dr
- 235 Olympia Dr Unit 2
- 235 Olympia Dr Unit 1
- 231 Olympia Dr
- 231 Olympia Dr Unit 3
- 229 Olympia Dr
- 229 Olympia Dr Unit 4
- 227 Olympia Dr
- 227 Olympia Dr Unit 5
- 225 Olympia Dr
- 225 Olympia Dr Unit 6
- 220 Hannum St
- 220 Hannum St Unit 5
- 326 Olympia Dr
- 222 Hannum St
- 222 Hannum St Unit 4
- 218 Hannum St
- 218 Hannum St Unit 6
- 218 Hannum St Unit U6
- 348 Olympia Dr