233 Quail Run Rd Ray City, GA 31645
Estimated Value: $50,532 - $165,000
3
Beds
2
Baths
1,344
Sq Ft
$74/Sq Ft
Est. Value
About This Home
This home is located at 233 Quail Run Rd, Ray City, GA 31645 and is currently estimated at $98,883, approximately $73 per square foot. 233 Quail Run Rd is a home with nearby schools including Berrien Primary School, Berrien Elementary School, and Berrien Middle School.
Ownership History
Date
Name
Owned For
Owner Type
Purchase Details
Closed on
Jun 8, 2018
Sold by
Hamilton Chance M
Bought by
Hamilton Lewis Ross
Current Estimated Value
Purchase Details
Closed on
Feb 11, 2015
Sold by
Clifford Sherrell
Bought by
Hamilton Chance M
Purchase Details
Closed on
Feb 22, 2008
Sold by
Keen Homes Inc
Bought by
Clifford Sherrell
Home Financials for this Owner
Home Financials are based on the most recent Mortgage that was taken out on this home.
Original Mortgage
$60,557
Interest Rate
5.46%
Mortgage Type
New Conventional
Purchase Details
Closed on
Dec 31, 2007
Sold by
Green Tree Servicing Llc
Bought by
Keen Homes Inc
Home Financials for this Owner
Home Financials are based on the most recent Mortgage that was taken out on this home.
Original Mortgage
$60,557
Interest Rate
5.46%
Mortgage Type
New Conventional
Purchase Details
Closed on
Dec 4, 2007
Sold by
Pope Charles R
Bought by
Green Tree Servicing Llc
Purchase Details
Closed on
Oct 13, 1997
Sold by
Hb Properties
Bought by
Pope Charles and Pope Dorm
Create a Home Valuation Report for This Property
The Home Valuation Report is an in-depth analysis detailing your home's value as well as a comparison with similar homes in the area
Home Values in the Area
Average Home Value in this Area
Purchase History
| Date | Buyer | Sale Price | Title Company |
|---|---|---|---|
| Hamilton Lewis Ross | -- | -- | |
| Hamilton Chance M | -- | -- | |
| Clifford Sherrell | -- | -- | |
| Clifford Sherrell | $50,000 | -- | |
| Keen Homes Inc | $31,000 | -- | |
| Green Tree Servicing Llc | $45,925 | -- | |
| Pope Charles | $6,700 | -- |
Source: Public Records
Mortgage History
| Date | Status | Borrower | Loan Amount |
|---|---|---|---|
| Previous Owner | Clifford Sherrell | $60,557 |
Source: Public Records
Tax History Compared to Growth
Tax History
| Year | Tax Paid | Tax Assessment Tax Assessment Total Assessment is a certain percentage of the fair market value that is determined by local assessors to be the total taxable value of land and additions on the property. | Land | Improvement |
|---|---|---|---|---|
| 2024 | $159 | $5,083 | $2,424 | $2,659 |
| 2023 | $160 | $5,083 | $2,424 | $2,659 |
| 2022 | $160 | $1,932 | $0 | $1,932 |
| 2021 | $161 | $1,932 | $0 | $1,932 |
| 2020 | $161 | $2,222 | $0 | $2,222 |
| 2019 | $162 | $2,222 | $0 | $2,222 |
| 2018 | $193 | $11,075 | $2,424 | $8,651 |
| 2017 | $288 | $11,075 | $2,424 | $8,651 |
| 2016 | $260 | $10,455 | $2,424 | $8,031 |
| 2014 | -- | $5,516 | $2,424 | $3,092 |
| 2013 | -- | $11,963 | $2,424 | $9,539 |
Source: Public Records
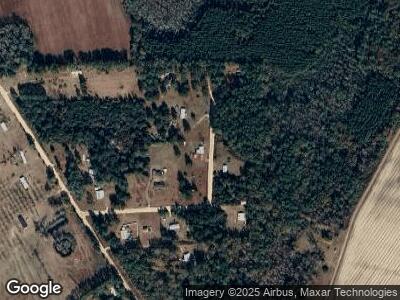
Map
Nearby Homes
- 233 Quail Run Rd
- 143 Quail Run Rd
- 229 Quail Run Rd
- 284 Quail Run Rd
- 1180 Ramblinwood Rd
- 156 Hog Wild Ln
- 1256 Ramblin Wood Rd
- 1254 Ramblinwood Rd
- 74 Hog Wild Ln
- 110 Hog Wild Ln
- 1420 Ramblinwood Rd
- 1083 Ramblinwood Rd
- 1047 Ramblinwood Rd
- 595 Rays Mill Pond Rd
- 575 Rays Mill Pond Rd
- 852 Ramblinwood Rd
- 719 Rays Mill Pond Rd
- 482 Rays Mill Pond Rd
- 438 Rays Mill Pond Rd
- 875 Rays Mill Pond Rd