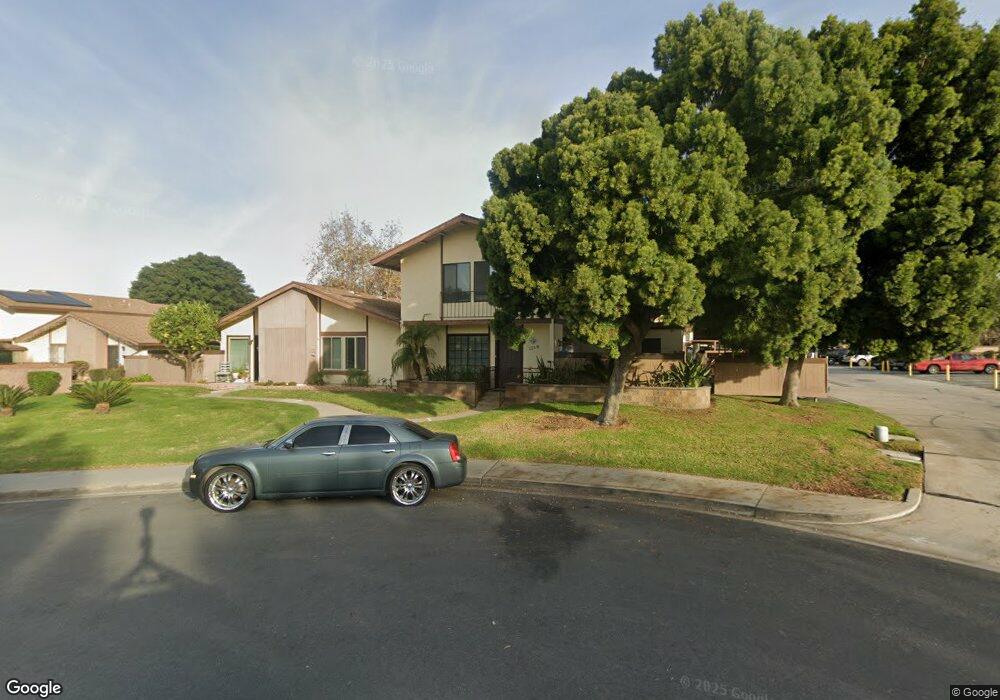
233 Regency Ct Unit D Chula Vista, CA 91911
Otay Mesa West NeighborhoodEstimated Value: $531,667 - $568,000
About This Home
This home is located at 233 Regency Ct Unit D, Chula Vista, CA 91911 and is currently estimated at $552,167, approximately $455 per square foot. 233 Regency Ct Unit D is a home located in San Diego County with nearby schools including Otay Elementary School, Castle Park Middle School, and Castle Park High School.
Ownership History
We collect this data history from publicly available records. To have your information removed, we recommend requesting removal directly through your county’s website.
Purchase Details
Purchase Details
Purchase Details
Purchase Details
Home Financials for this Owner
Home Financials are based on the most recent Mortgage that was taken out on this home.Purchase Details
Purchase Details
Home Values in the Area
Average Home Value in this Area
Purchase History
We collect this data history from publicly available records. To have your information removed, we recommend requesting removal directly through your county’s website.
| Date | Buyer | Sale Price | Title Company |
|---|---|---|---|
| $210,000 | California Title Company | ||
| -- | California Title Company | ||
| -- | California Title Company | ||
| $120,000 | California Title Company | ||
| -- | Fidelity National Title Ins | ||
| $85,000 | First American Title Ins Co | ||
| $88,000 | -- | ||
| $70,900 | -- |
Mortgage History
We collect this data history from publicly available records. To have your information removed, we recommend requesting removal directly through your county’s website.
| Date | Status | Borrower | Loan Amount |
|---|---|---|---|
| Previous Owner | $84,452 |
Tax History
We collect this data history from publicly available records. To have your information removed, we recommend requesting removal directly through your county’s website.
| Year | Tax Paid | Tax Assessment Tax Assessment Total Assessment is a certain percentage of the fair market value that is determined by local assessors to be the total taxable value of land and additions on the property. | Land | Improvement |
|---|---|---|---|---|
| 2025 | $3,030 | $258,585 | $92,658 | $165,927 |
| 2024 | $2,922 | $253,516 | $90,842 | $162,674 |
| 2023 | $2,881 | $248,546 | $89,061 | $159,485 |
| 2022 | $2,797 | $243,673 | $87,315 | $156,358 |
| 2021 | $2,732 | $238,896 | $85,603 | $153,293 |
| 2020 | $2,666 | $236,448 | $84,726 | $151,722 |
| 2019 | $2,597 | $231,813 | $83,065 | $148,748 |
| 2018 | $2,555 | $227,269 | $81,437 | $145,832 |
| 2017 | $2,501 | $222,814 | $79,841 | $142,973 |
| 2016 | $2,441 | $218,446 | $78,276 | $140,170 |
| 2015 | $2,406 | $215,166 | $77,101 | $138,065 |
| 2014 | $2,365 | $210,952 | $75,591 | $135,361 |
Map
- 232 Otay Valley Rd Unit C
- 238 Regency Ct Unit C
- 245 Palm Ave
- 265 Rancho Dr Unit C
- 1650 Walnut Dr
- 1679 Melrose Ave Unit H
- 1691 Melrose Ave
- 1687 Melrose Ave Unit D
- 1640 Maple Dr Unit 28
- 321 Rancho Dr
- 155 Walnut Dr
- 1594 Max Ave
- 1668 Ocala Ave
- 1571 Max Ave
- 4348 Powderhorn Dr
- 39 Tamarindo Way Unit 1
- 4026 Coleman Ave
- 764 Firethorn St
- 3852 Byrd St
- 88 Connoley Cir
- 233 Regency Ct Unit A
- 233 Regency Ct Unit C
- 233 Regency Ct Unit B
- 229 Regency Ct Unit A
- 229 Regency Ct Unit A
- 229 Regency Ct Unit C
- 229 Regency Ct Unit D
- 229 Regency Ct Unit B
- 221 Regency Ct Unit A
- 221 Regency Ct Unit C
- 221 Regency Ct Unit D
- 221 Regency Ct Unit B
- 225 Regency Ct Unit C
- 225 Regency Ct Unit D
- 225 Regency Ct Unit B
- 225 Regency Ct Unit A
- 232 Otay Valley Rd Unit D
- 232 Otay Valley Rd Unit B
- 232 Otay Valley Rd Unit A
- 232 Regency Ct Unit D
Ask me questions while you tour the home.