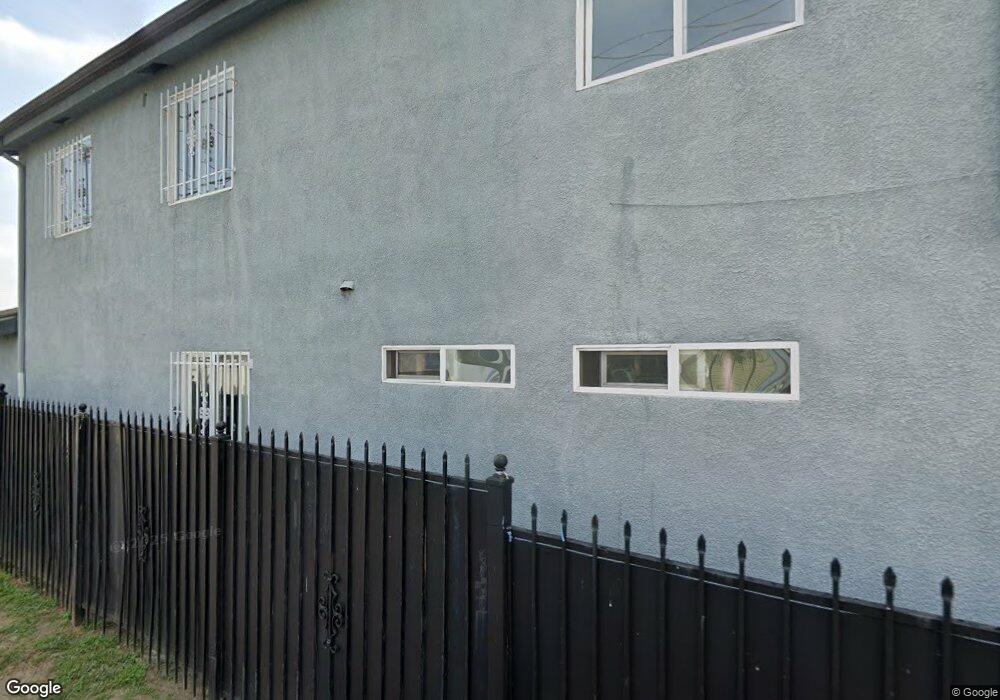
233 W 105th St Los Angeles, CA 90003
Broadway-Manchester NeighborhoodEstimated Value: $761,089 - $1,057,000
7
Beds
4
Baths
2,064
Sq Ft
$448/Sq Ft
Est. Value
About This Home
This home is located at 233 W 105th St, Los Angeles, CA 90003 and is currently estimated at $925,522, approximately $448 per square foot. 233 W 105th St is a home located in Los Angeles County with nearby schools including One Hundred Seventh Street Elementary School, Samuel Gompers Middle School, and Alliance College-Ready Middle Academy No. 4.
Ownership History
Date
Name
Owned For
Owner Type
Purchase Details
Closed on
Jul 8, 2008
Sold by
Seacliff Properties Inc
Bought by
Cyprus Kip C
Current Estimated Value
Home Financials for this Owner
Home Financials are based on the most recent Mortgage that was taken out on this home.
Original Mortgage
$393,250
Outstanding Balance
$258,034
Interest Rate
6.41%
Mortgage Type
Purchase Money Mortgage
Estimated Equity
$667,488
Purchase Details
Closed on
Oct 11, 2007
Sold by
West L A Neighborhood Development Llc
Bought by
Seacliff Properties Inc
Home Financials for this Owner
Home Financials are based on the most recent Mortgage that was taken out on this home.
Original Mortgage
$174,000
Interest Rate
6.29%
Mortgage Type
Unknown
Purchase Details
Closed on
Aug 10, 2007
Sold by
Gregory Diane and Estate Of Mildred L Wilkerson
Bought by
West L A Neighborhood Development Llc
Purchase Details
Closed on
Aug 15, 2005
Sold by
Wilkerson Samuel J
Bought by
Wilkerson Samuel J
Purchase Details
Closed on
Mar 21, 2002
Sold by
Wilkerson Mildred L
Bought by
Wilkerson Samuel J
Create a Home Valuation Report for This Property
The Home Valuation Report is an in-depth analysis detailing your home's value as well as a comparison with similar homes in the area
Home Values in the Area
Average Home Value in this Area
Purchase History
| Date | Buyer | Sale Price | Title Company |
|---|---|---|---|
| Cyprus Kip C | -- | Southland Title Corporation | |
| Seacliff Properties Inc | $200,000 | Southland Title Corporation | |
| West L A Neighborhood Development Llc | $175,000 | Fidelity National Title Co | |
| Wilkerson Samuel J | -- | -- | |
| Wilkerson Samuel J | -- | -- |
Source: Public Records
Mortgage History
| Date | Status | Borrower | Loan Amount |
|---|---|---|---|
| Open | Cyprus Kip C | $393,250 | |
| Previous Owner | Seacliff Properties Inc | $174,000 | |
| Previous Owner | Seacliff Properties Inc | $111,000 |
Source: Public Records
Tax History Compared to Growth
Tax History
| Year | Tax Paid | Tax Assessment Tax Assessment Total Assessment is a certain percentage of the fair market value that is determined by local assessors to be the total taxable value of land and additions on the property. | Land | Improvement |
|---|---|---|---|---|
| 2025 | $9,306 | $741,734 | $180,277 | $561,457 |
| 2024 | $9,306 | $727,192 | $176,743 | $550,449 |
| 2023 | $9,129 | $712,934 | $173,278 | $539,656 |
| 2022 | $8,714 | $698,956 | $169,881 | $529,075 |
| 2021 | $8,599 | $685,251 | $166,550 | $518,701 |
| 2019 | $8,344 | $230,877 | $230,877 | $0 |
| 2018 | $3,171 | $226,350 | $226,350 | $0 |
| 2016 | $2,975 | $217,561 | $217,561 | $0 |
| 2015 | $2,715 | $214,294 | $214,294 | $0 |
| 2014 | $2,737 | $210,097 | $210,097 | $0 |
Source: Public Records
Map
Nearby Homes
- 154 W 104th St
- 144 W 106th St
- 10712 S Broadway
- 224 W 101st St
- 220 W 101st St
- 144 W 101st St
- 10734 1/4 Main St
- 422 W 102nd St
- 10412 S Figueroa St
- 123 E 108th St
- 159 E 105th St
- 432 W 107th St
- 418 W 101st St
- 10210 S Figueroa St
- 10311 S Figueroa St
- 425 W 109th St
- 10955 S Spring St
- 215 E 107th St
- 226 E 105th St
- 514 W 102nd St
- 231 W 105th St
- 221 W 105th St
- 10420 S Broadway
- 219 W 105th St
- 230 W 104th St
- 217 W 105th St
- 226 W 104th St
- 10424 S Broadway
- 10404 S Broadway
- 222 W 104th St
- 10500 S Broadway
- 10500 S Broadway Unit 3
- 213 W 105th St
- 230 W 105th St
- 218 W 104th St
- 10400 S Broadway
- 226 W 105th St
- 10504 S Broadway
- 212 W 104th St
- 220 W 105th St