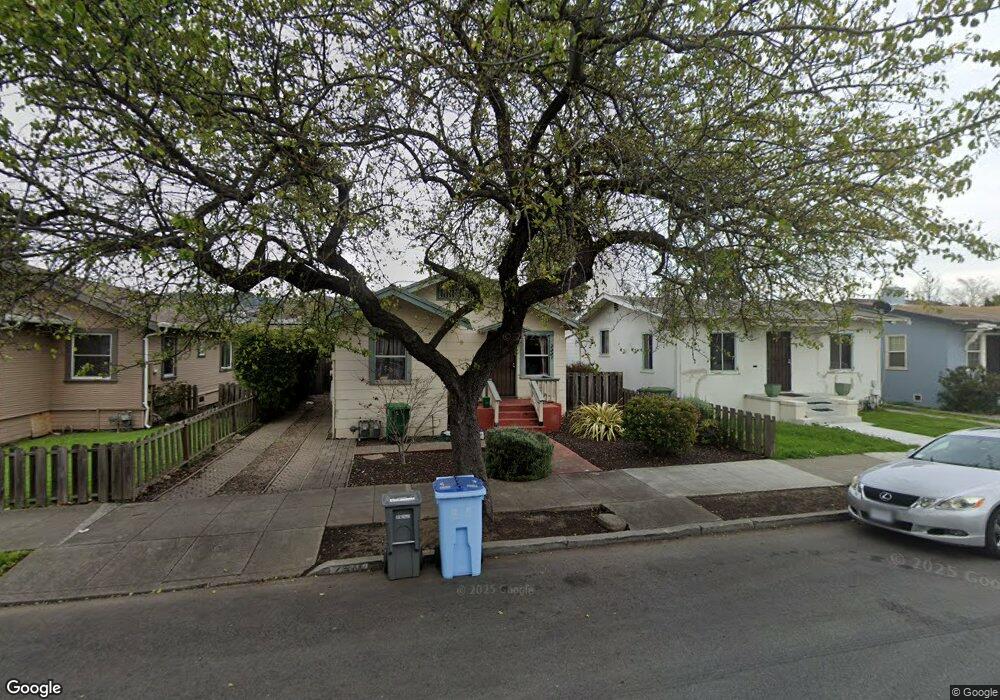
2331 Bonar St Berkeley, CA 94702
West Berkeley NeighborhoodEstimated Value: $1,106,000 - $1,572,000
3
Beds
2
Baths
1,520
Sq Ft
$885/Sq Ft
Est. Value
About This Home
This home is located at 2331 Bonar St, Berkeley, CA 94702 and is currently estimated at $1,345,475, approximately $885 per square foot. 2331 Bonar St is a home located in Alameda County with nearby schools including Oxford Elementary School, Washington Elementary School, and Malcolm X Elementary School.
Ownership History
Date
Name
Owned For
Owner Type
Purchase Details
Closed on
Aug 26, 2021
Sold by
Boucher Wayne Wallace and Boucher Marilyn Elizabeth
Bought by
Boucher Wayne Wallace and Boucher Marilyn Elizabeth
Current Estimated Value
Home Financials for this Owner
Home Financials are based on the most recent Mortgage that was taken out on this home.
Original Mortgage
$2,176,740
Outstanding Balance
$2,147,590
Interest Rate
2.8%
Mortgage Type
Reverse Mortgage Home Equity Conversion Mortgage
Estimated Equity
-$802,115
Purchase Details
Closed on
Jun 11, 2013
Sold by
Boucher Wayne Wallace and Boucher Marilyn Elizabeth
Bought by
Boucher Wayne Wallace and Boucher Marilyn Elizabeth
Purchase Details
Closed on
Feb 9, 2006
Sold by
Boucher Wayne and Boucher Marilyn
Bought by
Boucher Wayne and Boucher Marilyn
Home Financials for this Owner
Home Financials are based on the most recent Mortgage that was taken out on this home.
Original Mortgage
$300,000
Interest Rate
6.2%
Mortgage Type
Commercial
Purchase Details
Closed on
Jan 18, 2000
Sold by
Positano Investments Llc
Bought by
Boucher Wayne and Boucher Marilyn
Home Financials for this Owner
Home Financials are based on the most recent Mortgage that was taken out on this home.
Original Mortgage
$245,000
Interest Rate
7.84%
Mortgage Type
Commercial
Purchase Details
Closed on
Sep 20, 1999
Sold by
Ocwen Federal Bank
Bought by
Positano Investments Llc
Home Financials for this Owner
Home Financials are based on the most recent Mortgage that was taken out on this home.
Original Mortgage
$186,250
Interest Rate
8.09%
Mortgage Type
Commercial
Purchase Details
Closed on
Jun 22, 1999
Sold by
Tran Luong T
Bought by
Ocwen Financial Servicing Inc
Purchase Details
Closed on
Oct 28, 1997
Sold by
Tran Luong Thi and Vannguyen Sang
Bought by
Tran Luong Thi
Home Financials for this Owner
Home Financials are based on the most recent Mortgage that was taken out on this home.
Original Mortgage
$165,000
Interest Rate
11.12%
Mortgage Type
Commercial
Purchase Details
Closed on
Jul 29, 1996
Sold by
Yu Simon S C and Yu Renee H
Bought by
Tran Luong Thi and Vannguyen Sang
Home Financials for this Owner
Home Financials are based on the most recent Mortgage that was taken out on this home.
Original Mortgage
$112,700
Interest Rate
8.32%
Mortgage Type
Commercial
Purchase Details
Closed on
Nov 17, 1994
Sold by
Brown Carolyn
Bought by
Yu Simon S C and Yu Renee H
Create a Home Valuation Report for This Property
The Home Valuation Report is an in-depth analysis detailing your home's value as well as a comparison with similar homes in the area
Home Values in the Area
Average Home Value in this Area
Purchase History
| Date | Buyer | Sale Price | Title Company |
|---|---|---|---|
| Boucher Wayne Wallace | -- | Fnc Title Services Llc | |
| Boucher Wayne Wallace | -- | None Available | |
| Boucher Wayne | -- | First American Title Company | |
| Boucher Wayne | $350,000 | Chicago Title Co | |
| Positano Investments Llc | $186,500 | Chicago Title Co | |
| Ocwen Financial Servicing Inc | $230,000 | Chicago Title Co | |
| Tran Luong Thi | $82,545 | Fidelity National Title Co | |
| Tran Luong Thi | $161,000 | Fidelity National Title Co | |
| Yu Simon S C | $18,050 | -- |
Source: Public Records
Mortgage History
| Date | Status | Borrower | Loan Amount |
|---|---|---|---|
| Open | Boucher Wayne Wallace | $2,176,740 | |
| Previous Owner | Boucher Wayne | $300,000 | |
| Previous Owner | Boucher Wayne | $245,000 | |
| Previous Owner | Positano Investments Llc | $186,250 | |
| Previous Owner | Tran Luong Thi | $165,000 | |
| Previous Owner | Tran Luong Thi | $112,700 | |
| Closed | Tran Luong Thi | $32,200 |
Source: Public Records
Tax History
| Year | Tax Paid | Tax Assessment Tax Assessment Total Assessment is a certain percentage of the fair market value that is determined by local assessors to be the total taxable value of land and additions on the property. | Land | Improvement |
|---|---|---|---|---|
| 2025 | $9,541 | $530,911 | $161,373 | $376,538 |
| 2024 | $9,541 | $520,365 | $158,209 | $369,156 |
| 2023 | $9,327 | $517,026 | $155,108 | $361,918 |
| 2022 | $9,127 | $499,890 | $152,067 | $354,823 |
| 2021 | $9,123 | $489,954 | $149,086 | $347,868 |
| 2020 | $8,563 | $491,861 | $147,558 | $344,303 |
| 2019 | $8,146 | $482,218 | $144,665 | $337,553 |
| 2018 | $7,989 | $472,765 | $141,829 | $330,936 |
| 2017 | $7,677 | $463,497 | $139,049 | $324,448 |
| 2016 | $7,376 | $454,411 | $136,323 | $318,088 |
| 2015 | $7,270 | $447,586 | $134,276 | $313,310 |
| 2014 | $7,377 | $438,818 | $131,645 | $307,173 |
Source: Public Records
Map
Nearby Homes
- 2324 Browning St
- 2304 Edwards St
- 2231 Byron St
- 2437 Acton St
- 1142 Dwight Way
- 2350 Sacramento St
- 1118 Dwight Way
- 1039 Channing Way
- 2423 10th St
- 1135 Parker St
- 2341 9th St
- 1524 Blake St
- 1604 Dwight Way
- 917 Channing Way
- 1919 Curtis St
- 2717 Mabel St
- 2118 California St
- 1515 Derby St
- 1612 Parker St
- 2238 7th St
Your Personal Tour Guide
Ask me questions while you tour the home.