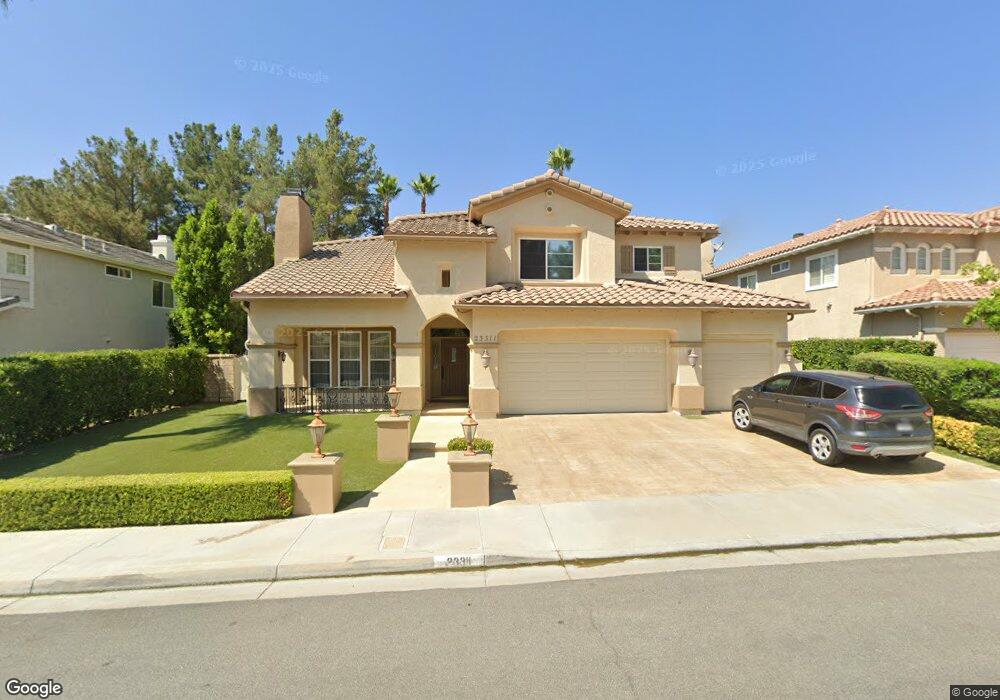
23311 Beaumont St Valencia, CA 91354
Estimated Value: $1,154,000 - $1,247,000
5
Beds
4
Baths
3,144
Sq Ft
$377/Sq Ft
Est. Value
About This Home
This home is located at 23311 Beaumont St, Valencia, CA 91354 and is currently estimated at $1,186,787, approximately $377 per square foot. 23311 Beaumont St is a home located in Los Angeles County with nearby schools including Charles Helmers Elementary School, Rio Norte Junior High School, and Valencia High School.
Ownership History
Date
Name
Owned For
Owner Type
Purchase Details
Closed on
Sep 27, 2000
Sold by
Matsuoka John K and Matsuoka Lea T
Bought by
Surma Gerry J and Surma Marilu
Current Estimated Value
Home Financials for this Owner
Home Financials are based on the most recent Mortgage that was taken out on this home.
Original Mortgage
$412,000
Outstanding Balance
$150,681
Interest Rate
7.96%
Estimated Equity
$1,036,106
Purchase Details
Closed on
Jun 3, 1997
Sold by
Newhall Land And Farming Co
Bought by
Vikron Inc
Purchase Details
Closed on
Mar 18, 1997
Sold by
Vikron Inc
Bought by
Matsuoka John K and Matsuoka Lea Anne T
Home Financials for this Owner
Home Financials are based on the most recent Mortgage that was taken out on this home.
Original Mortgage
$287,950
Interest Rate
7.7%
Create a Home Valuation Report for This Property
The Home Valuation Report is an in-depth analysis detailing your home's value as well as a comparison with similar homes in the area
Home Values in the Area
Average Home Value in this Area
Purchase History
| Date | Buyer | Sale Price | Title Company |
|---|---|---|---|
| Surma Gerry J | $515,000 | Investors Title Company | |
| Vikron Inc | -- | Chicago Title | |
| Matsuoka John K | $360,000 | Chicago Title Co |
Source: Public Records
Mortgage History
| Date | Status | Borrower | Loan Amount |
|---|---|---|---|
| Open | Surma Gerry J | $412,000 | |
| Previous Owner | Matsuoka John K | $287,950 | |
| Closed | Matsuoka John K | $53,950 | |
| Closed | Surma Gerry J | $26,000 |
Source: Public Records
Tax History Compared to Growth
Tax History
| Year | Tax Paid | Tax Assessment Tax Assessment Total Assessment is a certain percentage of the fair market value that is determined by local assessors to be the total taxable value of land and additions on the property. | Land | Improvement |
|---|---|---|---|---|
| 2025 | $10,970 | $776,007 | $276,194 | $499,813 |
| 2024 | $10,970 | $760,792 | $270,779 | $490,013 |
| 2023 | $10,699 | $745,875 | $265,470 | $480,405 |
| 2022 | $10,725 | $731,251 | $260,265 | $470,986 |
| 2021 | $10,453 | $716,913 | $255,162 | $461,751 |
| 2019 | $10,017 | $695,651 | $247,595 | $448,056 |
| 2018 | $9,852 | $682,012 | $242,741 | $439,271 |
| 2016 | $9,239 | $655,530 | $233,316 | $422,214 |
| 2015 | $8,923 | $645,684 | $229,812 | $415,872 |
| 2014 | $8,865 | $633,037 | $225,311 | $407,726 |
Source: Public Records
Map
Nearby Homes
- 27139 Vista Encantada Dr
- 27240 Trenton Place
- 27302 Weathersfield Dr
- 23422 Westford Place
- 23132 Posada Dr
- 23604 Sunderland Ct
- 27358 Brighton Ln
- 27251 Blakely Place
- 22903 Vista Delgado Dr
- 27371 Blueridge Dr
- 23141 La Granja Dr
- 27503 Wellsley Way
- 27504 Courtview Dr
- 27100 Sanford Way
- 27545 Wellsley Way
- 23054 La Granja Dr
- 27448 Bridgewater Dr
- 22810 Rio Chico Dr
- 27127 Rio Bosque Dr
- 27021 Rio Bosque Dr
- 23305 Beaumont St
- 23319 Beaumont St
- 27235 Trinidad Ct
- 27225 Trinidad Ct
- 27239 Trinidad Ct
- 23327 Beaumont St
- 23316 Beaumont St
- 23308 Beaumont St
- 23302 Beaumont St
- 23322 Beaumont St
- 23260 Beaumont St
- 27202 Trinidad Ct
- 23333 Beaumont St
- 27210 Trinidad Ct
- 27243 Trinidad Ct
- 23352 Camford Place
- 27218 Trinidad Ct
- 23254 Beaumont St
- 27234 Trinidad Ct
- 27222 Trinidad Ct