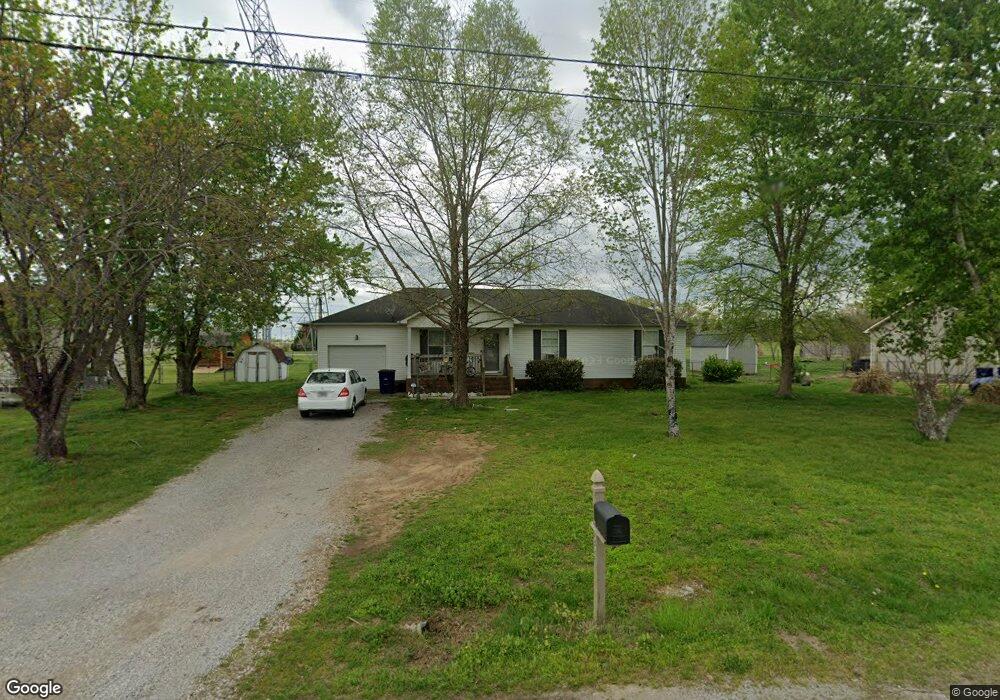
2334 Forrest Fields Dr Chapel Hill, TN 37034
Estimated Value: $285,325 - $315,000
Studio
2
Baths
1,196
Sq Ft
$253/Sq Ft
Est. Value
About This Home
This home is located at 2334 Forrest Fields Dr, Chapel Hill, TN 37034 and is currently estimated at $302,831, approximately $253 per square foot. 2334 Forrest Fields Dr is a home located in Marshall County with nearby schools including Chapel Hill Elementary School and Forrest School.
Ownership History
Date
Name
Owned For
Owner Type
Purchase Details
Closed on
Jan 25, 2021
Sold by
Nugent Donald Ryan
Bought by
Mckeever Britta Malee
Current Estimated Value
Purchase Details
Closed on
Oct 30, 2015
Sold by
Mckeever Jason Matthew
Bought by
Nugent Britta Malee
Purchase Details
Closed on
Sep 16, 2011
Sold by
Williams Janice S
Bought by
Mckeever Jason Matthew
Home Financials for this Owner
Home Financials are based on the most recent Mortgage that was taken out on this home.
Original Mortgage
$84,472
Interest Rate
4.24%
Mortgage Type
Commercial
Purchase Details
Closed on
Sep 26, 2000
Sold by
Mullins J R
Bought by
Janice Williams
Purchase Details
Closed on
Jul 11, 2000
Bought by
Mullins T R M&M Construction Co
Purchase Details
Closed on
Jun 12, 1998
Bought by
B & W Landscaping Llc Wayne Neese
Create a Home Valuation Report for This Property
The Home Valuation Report is an in-depth analysis detailing your home's value as well as a comparison with similar homes in the area
Purchase History
| Date | Buyer | Sale Price | Title Company |
|---|---|---|---|
| Mckeever Britta Malee | -- | None Available | |
| Nugent Britta Malee | -- | -- | |
| Mckeever Jason Matthew | $84,472 | -- | |
| Janice Williams | $86,900 | -- | |
| Mullins T R M&M Construction Co | $75,000 | -- | |
| B & W Landscaping Llc Wayne Neese | $90,000 | -- |
Source: Public Records
Mortgage History
| Date | Status | Borrower | Loan Amount |
|---|---|---|---|
| Previous Owner | Mckeever Jason Matthew | $84,472 |
Source: Public Records
Tax History
| Year | Tax Paid | Tax Assessment Tax Assessment Total Assessment is a certain percentage of the fair market value that is determined by local assessors to be the total taxable value of land and additions on the property. | Land | Improvement |
|---|---|---|---|---|
| 2025 | -- | $44,625 | $8,400 | $36,225 |
| 2024 | -- | $44,625 | $8,400 | $36,225 |
| 2023 | $1,216 | $44,625 | $8,400 | $36,225 |
| 2022 | $1,216 | $44,625 | $8,400 | $36,225 |
| 2021 | $1,224 | $28,400 | $6,725 | $21,675 |
| 2020 | $1,224 | $28,400 | $6,725 | $21,675 |
| 2019 | $1,224 | $28,400 | $6,725 | $21,675 |
| 2018 | $1,209 | $28,400 | $6,725 | $21,675 |
| 2017 | $1,209 | $28,400 | $6,725 | $21,675 |
| 2016 | $1,236 | $24,875 | $6,675 | $18,200 |
| 2015 | $1,236 | $24,875 | $6,675 | $18,200 |
| 2014 | $1,236 | $24,875 | $6,675 | $18,200 |
Source: Public Records
Map
Nearby Homes
- 0 Nashville Hwy Unit RTC2981706
- 0 Nashville Hwy Unit 5
- 0 Nashville Hwy Unit 3
- 0 Nashville Hwy Unit 1
- 0 Nashville Hwy Unit 4
- 0 Highway 270 Unit 9
- 0 Highway 270 Unit 8
- 401 Lauren Ln
- 200 S Horton Pkwy
- 206 Central Ave
- 210 Addison Ave
- 125 Stammer Farms Blvd
- 219 Addison Ave
- 216 Karley Ln
- 208 Karley Ln
- 402 Maggie Ct
- 115 Olivia Cir
- 0 Maggie Ct Unit 1,2,3
- 405 Edmonson Ave
- 0 Unionville Rd
- 2332 Forrest Fields Dr
- 2336 Forrest Fields Dr
- 2330 Forrest Fields Dr
- 2333 Forrest Fields Dr
- 2335 Forrest Fields Dr
- 2331 Forrest Fields Dr
- 2328 Forrest Fields Dr
- 2329 Forrest Fields Dr
- 2303 Forrest Fields Dr
- 2327 Forrest Fields Dr
- 2301 Forrest Fields Dr
- 2326 Forrest Fields Dr
- 2305 Forrest Fields
- 4620 Nashville Hwy
- 2307 Forrest Fields Dr
- 2325 Forrest Fields Dr
- 2309 Forrest Fields Dr
- 2324 Forrest Fields Dr
- 2302 Forrest Fields Dr
- 2304 Forrest Fields Dr
Your Personal Tour Guide
Ask me questions while you tour the home.