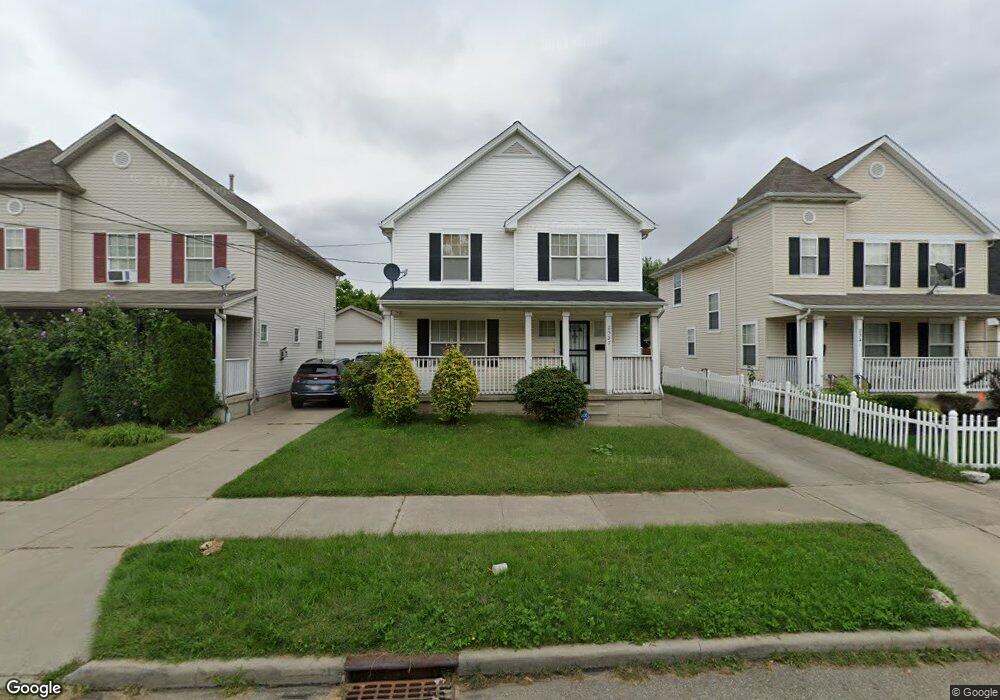
2337 E 63rd St Cleveland, OH 44104
Fairfax NeighborhoodEstimated Value: $198,000 - $225,000
3
Beds
3
Baths
1,380
Sq Ft
$152/Sq Ft
Est. Value
About This Home
This home is located at 2337 E 63rd St, Cleveland, OH 44104 and is currently estimated at $209,409, approximately $151 per square foot. 2337 E 63rd St is a home located in Cuyahoga County with nearby schools including St. Adalbert Catholic School.
Ownership History
Date
Name
Owned For
Owner Type
Purchase Details
Closed on
Apr 29, 2010
Sold by
Re Hab It Inc
Bought by
Lawrence Shirley
Current Estimated Value
Home Financials for this Owner
Home Financials are based on the most recent Mortgage that was taken out on this home.
Original Mortgage
$117,727
Outstanding Balance
$78,812
Interest Rate
5.5%
Mortgage Type
FHA
Estimated Equity
$130,597
Purchase Details
Closed on
Apr 10, 2009
Sold by
Keybank National Association
Bought by
Re Hab It Inc
Purchase Details
Closed on
Dec 12, 2008
Sold by
Bandy Mary K and Bandy Dorothy
Bought by
Keybank National Association
Purchase Details
Closed on
Aug 6, 2001
Sold by
Burten Bell Carr Development Inc
Bought by
Bfr Partners Company Llc
Purchase Details
Closed on
Feb 4, 1993
Sold by
Ellis Lillian
Bought by
Cleveland ,City Of Lb93
Purchase Details
Closed on
Jan 1, 1975
Bought by
Ellis Lillian
Create a Home Valuation Report for This Property
The Home Valuation Report is an in-depth analysis detailing your home's value as well as a comparison with similar homes in the area
Home Values in the Area
Average Home Value in this Area
Purchase History
| Date | Buyer | Sale Price | Title Company |
|---|---|---|---|
| Lawrence Shirley | $119,900 | Equity Title Agency | |
| Re Hab It Inc | $29,000 | Attorney | |
| Keybank National Association | $40,000 | None Available | |
| Bfr Partners Company Llc | -- | Heights Title Agency Inc | |
| Cleveland ,City Of Lb93 | -- | -- | |
| Ellis Lillian | -- | -- |
Source: Public Records
Mortgage History
| Date | Status | Borrower | Loan Amount |
|---|---|---|---|
| Open | Lawrence Shirley | $117,727 |
Source: Public Records
Tax History
| Year | Tax Paid | Tax Assessment Tax Assessment Total Assessment is a certain percentage of the fair market value that is determined by local assessors to be the total taxable value of land and additions on the property. | Land | Improvement |
|---|---|---|---|---|
| 2025 | $4,262 | $63,700 | $7,455 | $56,245 |
| 2024 | $4,260 | $63,700 | $7,455 | $56,245 |
| 2023 | $3,847 | $49,630 | $8,050 | $41,580 |
| 2022 | $3,826 | $49,630 | $8,050 | $41,580 |
| 2021 | $3,790 | $49,630 | $8,050 | $41,580 |
| 2020 | $4,060 | $45,960 | $7,460 | $38,500 |
| 2019 | $3,760 | $131,300 | $21,300 | $110,000 |
| 2018 | $2,123 | $45,960 | $7,460 | $38,500 |
| 2017 | $3,427 | $40,530 | $5,950 | $34,580 |
| 2016 | $499 | $5,950 | $5,950 | $0 |
| 2015 | $478 | $5,950 | $5,950 | $0 |
| 2014 | $478 | $5,670 | $5,670 | $0 |
Source: Public Records
Map
Nearby Homes
- 2364 E 59th St
- 6523 Scovill Ave
- 2182 E 68th St
- 7305 Montgomery Ave
- 0 E 46th St Unit 5167443
- 3773 Thurgood Ave
- 3705 Central Ave
- 2254 E 81st St
- 2346 E 82nd St
- 2182 E 80th St
- 2200 E 81st St
- 2201 E 36th St
- 5611 Grand Ave
- 5609 Grand Ave
- 2193 E 35th St
- 6711 Lucerne Ave
- 1755 E 63rd St
- 2256 E 85th St
- 2538 E 84th St
- 0 E 86th St Unit 5150892
Your Personal Tour Guide
Ask me questions while you tour the home.