2338 42nd Ave E Seattle, WA 98112
Madison Park NeighborhoodEstimated Value: $2,343,814 - $2,687,000
3
Beds
3
Baths
2,700
Sq Ft
$929/Sq Ft
Est. Value
About This Home
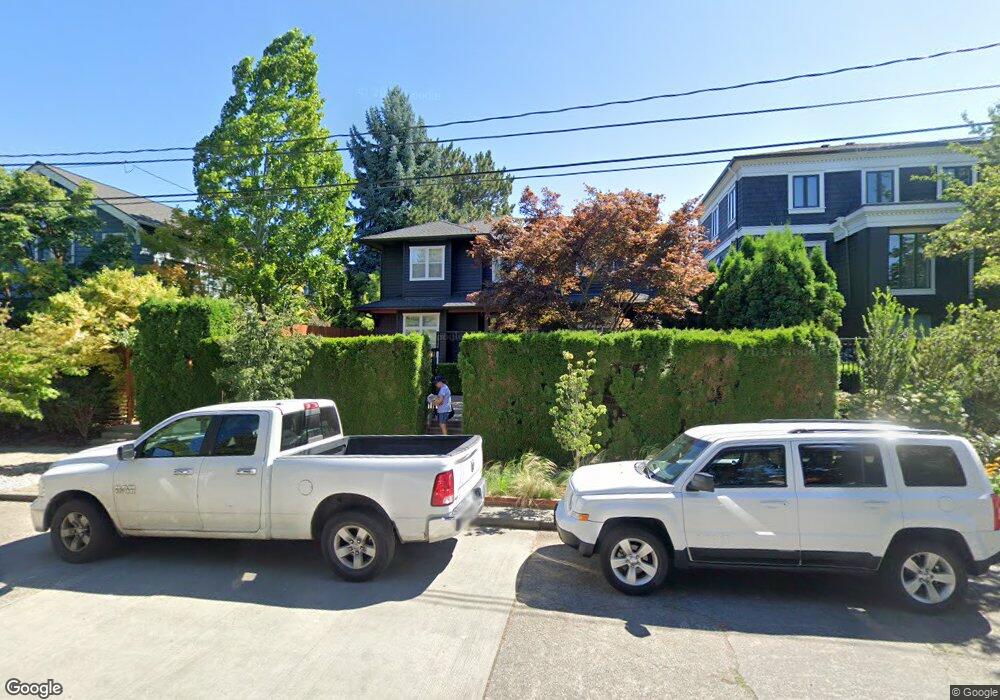
This home is located at 2338 42nd Ave E, Seattle, WA 98112 and is currently estimated at $2,507,704, approximately $928 per square foot. 2338 42nd Ave E is a home located in King County with nearby schools including McGilvra Elementary School, Meany Middle School, and Garfield High School.
Ownership History
Date
Name
Owned For
Owner Type
Purchase Details
Closed on
Jul 22, 2004
Sold by
Mcfarlan E Thomas
Bought by
Wong Tracy and Wong Jennifer
Current Estimated Value
Home Financials for this Owner
Home Financials are based on the most recent Mortgage that was taken out on this home.
Original Mortgage
$705,000
Outstanding Balance
$353,819
Interest Rate
6.29%
Mortgage Type
Purchase Money Mortgage
Estimated Equity
$2,153,885
Purchase Details
Closed on
Jul 23, 1997
Sold by
Crawford Stephen W and Crawford Lisa E
Bought by
Mcfarlan E Thomas
Purchase Details
Closed on
Apr 19, 1995
Sold by
Wilson Deborah Jane and Hoadley William M
Bought by
Crawford Stephen W and Crawford Lisa E
Home Financials for this Owner
Home Financials are based on the most recent Mortgage that was taken out on this home.
Original Mortgage
$359,000
Interest Rate
8.44%
Purchase Details
Closed on
May 7, 1992
Sold by
Raymond Jon D and Raymond Sally
Bought by
Wilson Deborah Jane and Wilson Hoadley
Create a Home Valuation Report for This Property
The Home Valuation Report is an in-depth analysis detailing your home's value as well as a comparison with similar homes in the area
Home Values in the Area
Average Home Value in this Area
Purchase History
| Date | Buyer | Sale Price | Title Company |
|---|---|---|---|
| Wong Tracy | $940,000 | Chicago Title | |
| Mcfarlan E Thomas | $525,000 | Chicago Title Insurance Co | |
| Crawford Stephen W | $449,000 | Chicago Title Insurance Co | |
| Wilson Deborah Jane | $410,000 | -- |
Source: Public Records
Mortgage History
| Date | Status | Borrower | Loan Amount |
|---|---|---|---|
| Open | Wong Tracy | $705,000 | |
| Previous Owner | Crawford Stephen W | $359,000 |
Source: Public Records
Tax History
| Year | Tax Paid | Tax Assessment Tax Assessment Total Assessment is a certain percentage of the fair market value that is determined by local assessors to be the total taxable value of land and additions on the property. | Land | Improvement |
|---|---|---|---|---|
| 2024 | $19,237 | $2,007,000 | $1,332,000 | $675,000 |
| 2023 | $18,250 | $1,931,000 | $1,242,000 | $689,000 |
| 2022 | $16,119 | $2,163,000 | $1,242,000 | $921,000 |
| 2021 | $14,407 | $1,752,000 | $1,006,000 | $746,000 |
| 2020 | $15,093 | $1,481,000 | $969,000 | $512,000 |
| 2018 | $14,368 | $1,555,000 | $990,000 | $565,000 |
| 2017 | $12,477 | $1,451,000 | $877,000 | $574,000 |
| 2016 | $12,079 | $1,301,000 | $766,000 | $535,000 |
| 2015 | $11,492 | $1,231,000 | $726,000 | $505,000 |
| 2014 | -- | $1,200,000 | $609,000 | $591,000 |
| 2013 | -- | $1,092,000 | $609,000 | $483,000 |
Source: Public Records
Map
Nearby Homes
- 2360 43rd Ave E Unit 214
- 2360 43rd Ave E Unit 203
- 2360 43rd Ave E Unit 404
- 2360 43rd Ave E Unit 211
- 2040 43rd Ave E Unit 313
- 2009 42nd Ave E
- 2501 Canterbury Ln E Unit 106
- 2502 Canterbury Ln E Unit 406
- 2501 Canterbury Ln E Unit 215
- 2540 39th Ave E Unit 5
- 1929 42nd Ave E Unit B
- 2538 39th Ave E Unit 6
- 2105 38th Ave E
- 1800 43rd Ave E Unit 401
- 1620 43rd Ave E Unit 23B
- 1620 43rd Ave E Unit 8C
- 1620 43rd Ave E Unit 1B
- 1600 43rd Ave E Unit 209
- 1600 43rd Ave E Unit 211
- 1615 39th Ave E
- 2332 42nd Ave E
- 2342 42nd Ave E
- 2340 42nd Ave E
- 2328 42nd Ave E
- 2330 42nd Ave E
- 4211 E Mcgilvra St Unit B
- 4211 E Mcgilvra St Unit C
- 4205 E Mcgilvra St
- 2324 42nd Ave E
- 2341 43rd Ave E
- 2333 43rd Ave E
- 2333 43rd Ave E Unit 103
- 2333 43rd Ave E Unit 202
- 2333 43rd Ave E Unit 301
- 2333 43rd Ave E Unit 203
- 2333 43rd Ave E Unit 303
- 2333 43rd Ave E Unit 302
- 2333 43rd Ave E Unit 101
- 2333 43rd Ave E Unit 102
Your Personal Tour Guide
Ask me questions while you tour the home.