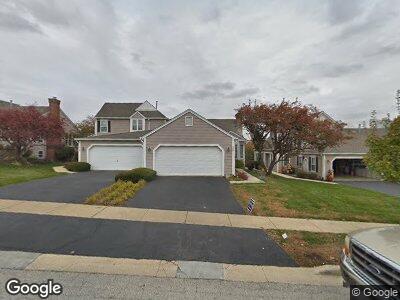
234 Sedgewick Cir Saint Charles, IL 60174
Wildrose NeighborhoodEstimated Value: $391,441 - $445,000
3
Beds
3
Baths
1,800
Sq Ft
$235/Sq Ft
Est. Value
About This Home
This home is located at 234 Sedgewick Cir, Saint Charles, IL 60174 and is currently estimated at $422,110, approximately $234 per square foot. 234 Sedgewick Cir is a home located in Kane County with nearby schools including Wild Rose Elementary School, Wredling Middle School, and St Charles North High School.
Ownership History
Date
Name
Owned For
Owner Type
Purchase Details
Closed on
Dec 18, 2009
Sold by
Carroll Measells Gloria D
Bought by
The Gloria D Carroll Measells 2009 Decla
Current Estimated Value
Purchase Details
Closed on
Oct 15, 2009
Sold by
Kolomyjec William J
Bought by
Carroll Measells Gloria D
Home Financials for this Owner
Home Financials are based on the most recent Mortgage that was taken out on this home.
Original Mortgage
$124,000
Interest Rate
5.1%
Mortgage Type
New Conventional
Purchase Details
Closed on
May 30, 2001
Sold by
Zaferopulos Yvonne
Bought by
Kolomyjec William J
Home Financials for this Owner
Home Financials are based on the most recent Mortgage that was taken out on this home.
Original Mortgage
$125,000
Interest Rate
7.23%
Create a Home Valuation Report for This Property
The Home Valuation Report is an in-depth analysis detailing your home's value as well as a comparison with similar homes in the area
Home Values in the Area
Average Home Value in this Area
Purchase History
| Date | Buyer | Sale Price | Title Company |
|---|---|---|---|
| The Gloria D Carroll Measells 2009 Decla | -- | None Available | |
| Carroll Measells Gloria D | $251,000 | Fox Title Company | |
| Kolomyjec William J | $222,500 | Chicago Title Insurance Co |
Source: Public Records
Mortgage History
| Date | Status | Borrower | Loan Amount |
|---|---|---|---|
| Open | Carroll Measells Gloria D | $119,000 | |
| Closed | Carroll Measells Gloria D | $124,000 | |
| Previous Owner | Kolomyjec William J | $100,000 | |
| Previous Owner | Kolomyjec William J | $116,000 | |
| Previous Owner | Kolomyjec William J | $40,000 | |
| Previous Owner | Kolomyjec William J | $125,000 |
Source: Public Records
Tax History Compared to Growth
Tax History
| Year | Tax Paid | Tax Assessment Tax Assessment Total Assessment is a certain percentage of the fair market value that is determined by local assessors to be the total taxable value of land and additions on the property. | Land | Improvement |
|---|---|---|---|---|
| 2023 | $6,544 | $97,771 | $23,331 | $74,440 |
| 2022 | $6,398 | $90,240 | $25,825 | $64,415 |
| 2021 | $6,118 | $86,016 | $24,616 | $61,400 |
| 2020 | $6,042 | $84,412 | $24,157 | $60,255 |
| 2019 | $5,792 | $81,181 | $23,679 | $57,502 |
| 2018 | $5,941 | $82,627 | $22,778 | $59,849 |
| 2017 | $5,765 | $79,802 | $22,000 | $57,802 |
| 2016 | $6,029 | $76,999 | $21,227 | $55,772 |
| 2015 | -- | $75,059 | $20,998 | $54,061 |
| 2014 | -- | $75,422 | $20,998 | $54,424 |
| 2013 | -- | $74,476 | $21,208 | $53,268 |
Source: Public Records
Map
Nearby Homes
- 231 Sedgewick Cir
- 115 Lewis Ct
- 814 State St
- 940 W Main St
- 50 S 1st St Unit 5D
- 22 N 12th St
- 617 N 5th Ave
- 19 S 11th St
- 10 Illinois St Unit 5A
- 108 S 11th St
- 315 S 8th St
- 362 Brownstone Dr Unit 362
- 318 S 13th St
- 607 Geneva Rd
- 416 S 10th Ct
- 627 S 2nd St
- 304 S 6th Ave
- 822 Indiana Ave
- 205 S 10th Ave
- 2035 Thornwood Cir Unit 3
- 234 Sedgewick Cir
- 236 Sedgewick Cir
- 232 Sedgewick Cir Unit 1
- 230 Sedgewick Cir
- 238 Sedgewick Cir Unit 1
- 228 Sedgewick Cir
- 240 Sedgewick Cir
- 233 Sedgewick Cir Unit 1
- 222 Millington Way
- 235 Sedgewick Cir
- 237 Sedgewick Cir Unit 1
- 242 Sedgewick Cir
- 226 Sedgewick Cir
- 229 Sedgewick Cir Unit 1
- 227 Sedgewick Cir Unit 1
- 220 Millington Way
- 244 Sedgewick Cir Unit 1
- 244 Benham Ct Unit 13G
- 246 Benham Ct
- 246 Sedgewick Cir Unit 1