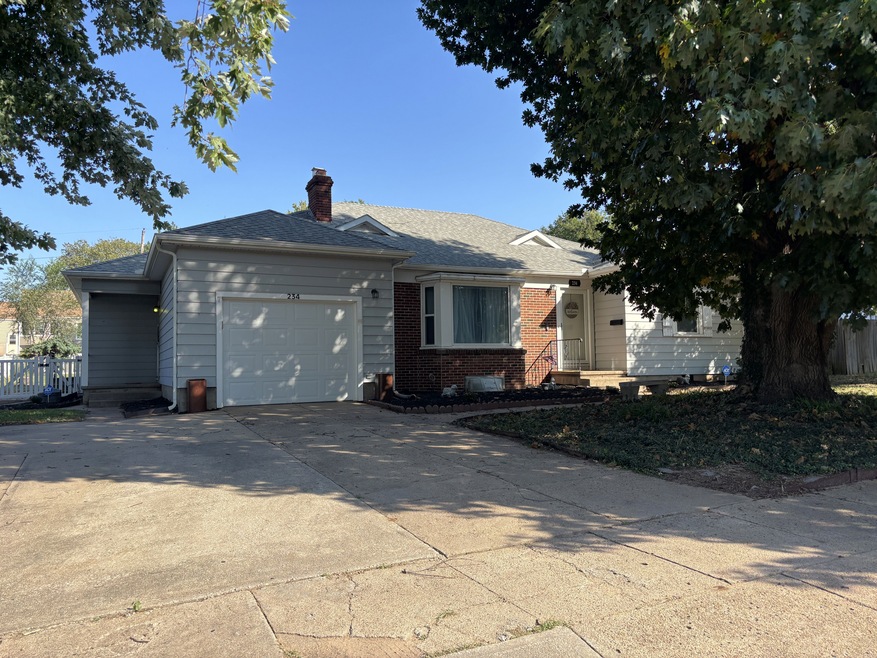
234 W E Ave Kingman, KS 67068
Estimated payment $1,100/month
Total Views
1,816
3
Beds
2
Baths
1,870
Sq Ft
$90
Price per Sq Ft
About This Home
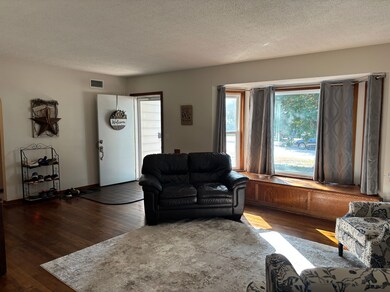
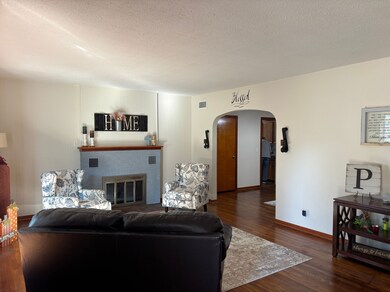
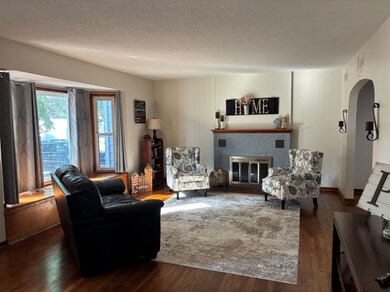
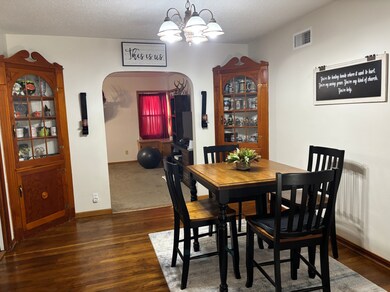
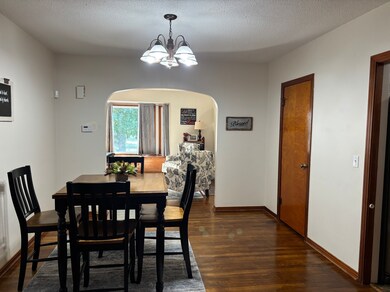
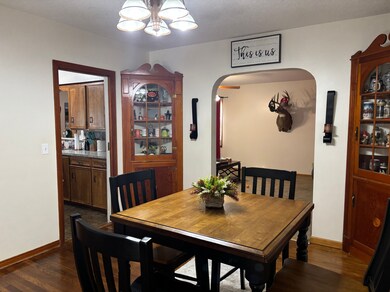
Welcome to this well-maintained 3 bedroom, 2 bath ranch-style home offering 1,870 sq. ft. of inviting living space, perfectly located within walking distance to downtown Kingman, Kingman Elementary School, and St Patrick's School. With its classic charm, hardwood floors, thoughtful updates, and unbeatable location, this home is a true gem in a friendly, walkable neighborhood. The fenced backyard offers a deck and plenty of room to entertain.
Listing Agent
Mike Floyd
Floyd Auction & Real Estate LLC Listed on: 11/04/2025
Listing Provided By

Home Details
Home Type
- Single Family
Est. Annual Taxes
- $2,606
Lot Details
- Property fronts an alley
- Few Trees
- Current uses include residential multi-family
- Potential uses include residential multi-family
Bedrooms and Bathrooms
- 3 Bedrooms
- 2 Full Bathrooms
Map
Create a Home Valuation Report for This Property
The Home Valuation Report is an in-depth analysis detailing your home's value as well as a comparison with similar homes in the area
Home Values in the Area
Average Home Value in this Area
Tax History
| Year | Tax Paid | Tax Assessment Tax Assessment Total Assessment is a certain percentage of the fair market value that is determined by local assessors to be the total taxable value of land and additions on the property. | Land | Improvement |
|---|---|---|---|---|
| 2025 | $2,606 | $16,882 | $1,217 | $15,665 |
| 2024 | $2,606 | $14,345 | $1,107 | $13,238 |
| 2023 | $2,425 | $13,282 | $990 | $12,292 |
| 2022 | $1,456 | $7,984 | $898 | $7,086 |
| 2021 | $1,446 | $7,752 | $857 | $6,895 |
| 2020 | $1,486 | $7,675 | $803 | $6,872 |
| 2019 | $1,422 | $7,452 | $803 | $6,649 |
| 2018 | $1,394 | $7,176 | $726 | $6,450 |
| 2017 | $1,461 | $7,602 | $726 | $6,876 |
| 2016 | $1,391 | $7,592 | $726 | $6,866 |
| 2015 | -- | $10,212 | $1,106 | $9,106 |
| 2014 | -- | $10,212 | $1,106 | $9,106 |
Source: Public Records
Property History
| Date | Event | Price | List to Sale | Price per Sq Ft | Prior Sale |
|---|---|---|---|---|---|
| 10/17/2025 10/17/25 | For Sale | $167,900 | +5.6% | $90 / Sq Ft | |
| 07/15/2024 07/15/24 | Sold | -- | -- | -- | View Prior Sale |
| 06/11/2024 06/11/24 | Pending | -- | -- | -- | |
| 05/25/2024 05/25/24 | Price Changed | $159,000 | 0.0% | $83 / Sq Ft | |
| 05/25/2024 05/25/24 | For Sale | $159,000 | -5.9% | $83 / Sq Ft | |
| 05/18/2024 05/18/24 | Off Market | -- | -- | -- | |
| 04/26/2024 04/26/24 | Price Changed | $169,000 | +6.3% | $88 / Sq Ft | |
| 04/12/2024 04/12/24 | For Sale | $159,000 | 0.0% | $83 / Sq Ft | |
| 03/17/2024 03/17/24 | Pending | -- | -- | -- | |
| 03/16/2024 03/16/24 | Pending | -- | -- | -- | |
| 03/12/2024 03/12/24 | For Sale | $159,000 | +9.7% | $83 / Sq Ft | |
| 04/27/2022 04/27/22 | Sold | -- | -- | -- | View Prior Sale |
| 03/22/2022 03/22/22 | Pending | -- | -- | -- | |
| 03/18/2022 03/18/22 | For Sale | $145,000 | -- | $76 / Sq Ft |
Purchase History
| Date | Type | Sale Price | Title Company |
|---|---|---|---|
| Warranty Deed | -- | -- |
Source: Public Records
Mortgage History
| Date | Status | Loan Amount | Loan Type |
|---|---|---|---|
| Open | $72,800 | No Value Available |
Source: Public Records
Nearby Homes
- 635 N Cedar St
- 726 N Cedar St
- 242 W C Ave
- 130 W C Ave
- 735 N Spruce St
- 236 W A Ave
- 520 W A Ave
- 245 E C Ave
- 415 E F Ave
- 1213 N Walnut St
- 437 E D Ave
- 00000 W Copeland Ave
- 1200 Chariton St
- 1721 N Walnut St
- 910 E Hwy 54
- 0 N Koch Industrial Ln
- 2105 N Koch Industrial Ave
- 00000 NW 10th Ave
- 875 NE 20 Ave
- 00000 S Dean Rd