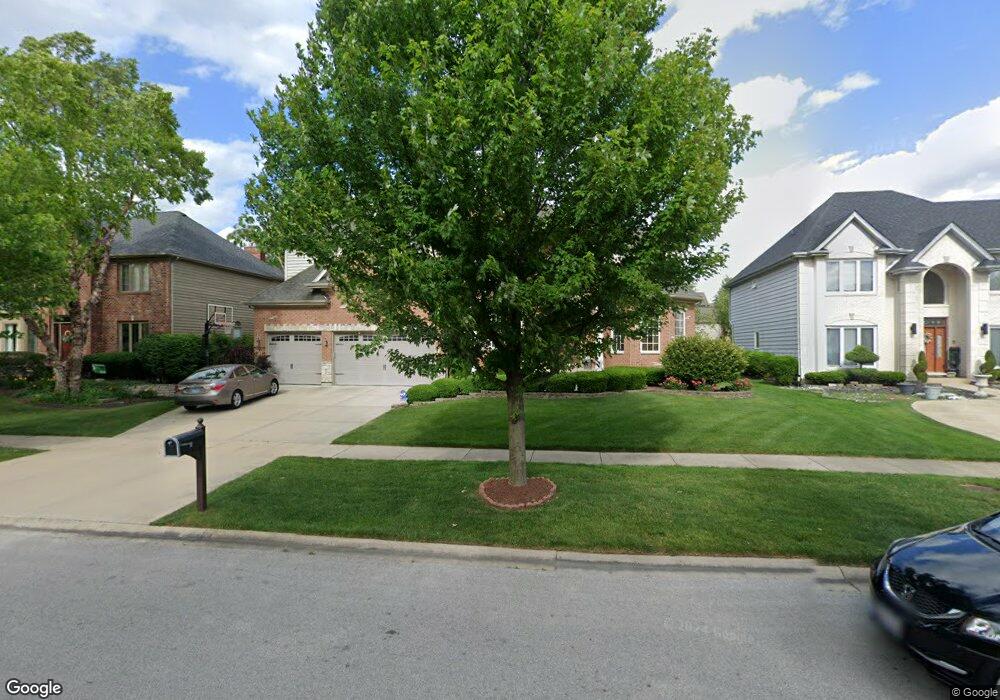
2340 Fox Boro Ln Naperville, IL 60564
Stillwater NeighborhoodEstimated Value: $867,000 - $1,219,000
5
Beds
5
Baths
4,400
Sq Ft
$247/Sq Ft
Est. Value
About This Home
This home is located at 2340 Fox Boro Ln, Naperville, IL 60564 and is currently estimated at $1,084,835, approximately $246 per square foot. 2340 Fox Boro Ln is a home located in Will County with nearby schools including Williamsfield Elementary School, Welch Elementary School, and Ellsworth Elementary School.
Ownership History
Date
Name
Owned For
Owner Type
Purchase Details
Closed on
Nov 12, 2013
Sold by
Ganju Ashish and Gaqnju Shalini
Bought by
Ashish Ganju Revocable Trust and Shalini Ganju Revocable Trust
Current Estimated Value
Purchase Details
Closed on
Jul 23, 2010
Sold by
Dirilten Kamil R
Bought by
Ganju Ashish and Ganju Shalini
Home Financials for this Owner
Home Financials are based on the most recent Mortgage that was taken out on this home.
Original Mortgage
$640,000
Interest Rate
4.5%
Mortgage Type
New Conventional
Create a Home Valuation Report for This Property
The Home Valuation Report is an in-depth analysis detailing your home's value as well as a comparison with similar homes in the area
Home Values in the Area
Average Home Value in this Area
Purchase History
| Date | Buyer | Sale Price | Title Company |
|---|---|---|---|
| Ashish Ganju Revocable Trust | -- | None Available | |
| Ganju Ashish | $800,000 | Attorneys Title Guaranty Fun |
Source: Public Records
Mortgage History
| Date | Status | Borrower | Loan Amount |
|---|---|---|---|
| Previous Owner | Ganju Ashish | $640,000 |
Source: Public Records
Tax History Compared to Growth
Tax History
| Year | Tax Paid | Tax Assessment Tax Assessment Total Assessment is a certain percentage of the fair market value that is determined by local assessors to be the total taxable value of land and additions on the property. | Land | Improvement |
|---|---|---|---|---|
| 2024 | $20,213 | $316,594 | $72,166 | $244,428 |
| 2023 | $20,213 | $279,677 | $63,751 | $215,926 |
| 2022 | $18,734 | $264,570 | $60,307 | $204,263 |
| 2021 | $17,917 | $251,971 | $57,435 | $194,536 |
| 2020 | $17,580 | $247,979 | $56,525 | $191,454 |
| 2019 | $17,285 | $240,990 | $54,932 | $186,058 |
| 2018 | $17,224 | $235,929 | $53,724 | $182,205 |
| 2017 | $16,967 | $229,838 | $52,337 | $177,501 |
| 2016 | $16,941 | $224,890 | $51,210 | $173,680 |
| 2015 | $17,125 | $216,240 | $49,240 | $167,000 |
| 2014 | $17,125 | $210,770 | $49,240 | $161,530 |
| 2013 | $17,125 | $210,770 | $49,240 | $161,530 |
Source: Public Records
Map
Nearby Homes
- 2543 Dewes Ln
- 2736 Bluewater Cir
- 2611 Cedar Glade Dr Unit 204
- 2511 Sheehan Dr Unit 203
- 2220 Waterleaf Ct Unit 204
- 2227 Waterleaf Ct Unit 203
- 2866 Stonewater Dr Unit 102
- 2207 Sisters Ave
- 28W555 Leverenz Rd
- 2636 Salix Cir
- 4284 Stableford Ln
- 2301 Mecan Dr
- 1512 Harbour Towne Place
- 3311 Fairmont Ave
- 1329 Neskola Ct
- 2949 Brossman St
- 3316 Club Ct
- 1321 Galena Ct
- 4258 Stableford Ln
- 3349 Rosecroft Ln Unit 2
- 2344 Fox Boro Ln
- 2427 Hillsboro Ln
- 2332 Fox Boro Ln Unit 2
- 2402 Fox Boro Ln
- 2423 Hillsboro Ln
- 2339 Fox Boro Ln Unit 3
- 2343 Fox Boro Ln
- 2335 Fox Boro Ln
- 2328 Fox Boro Ln
- 2347 Fox Boro Ln
- 2404 Fox Boro Ln
- 2343 Simsbury Ct
- 2352 Simsbury Ct
- 2331 Fox Boro Ln
- 2351 Fox Boro Ln
- 2419 Hillsboro Ln
- 2424 Hillsboro Ln Unit 4
- 2324 Fox Boro Ln
- 2420 Hillsboro Ln
- 2403 Fox Boro Ln