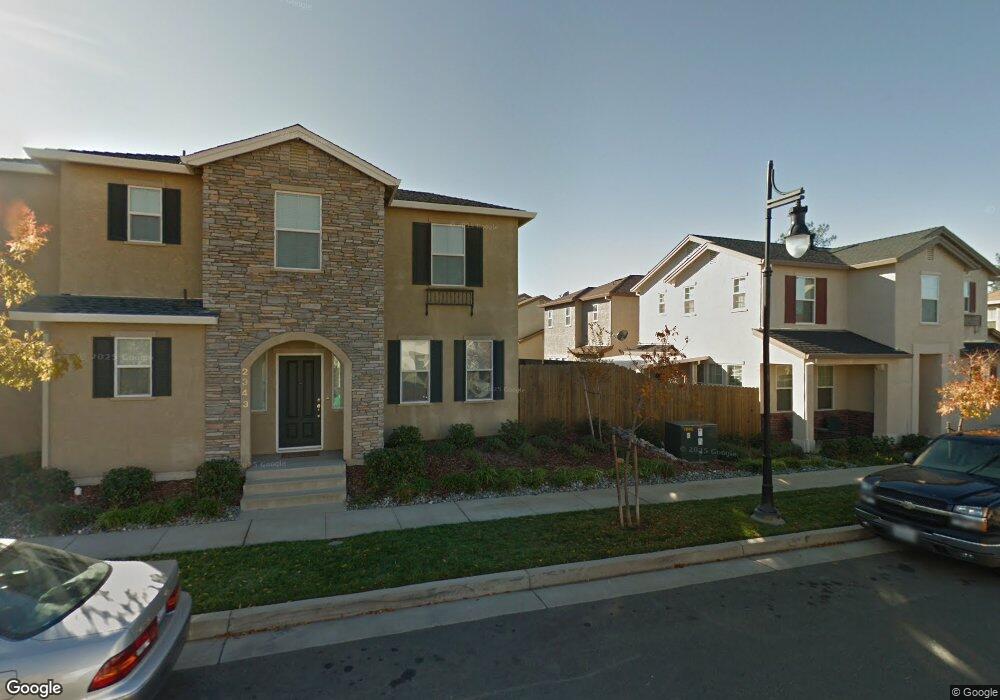
2341 Shining Star Way Redding, CA 96003
North Shasta View NeighborhoodEstimated Value: $338,000 - $350,000
3
Beds
3
Baths
1,653
Sq Ft
$207/Sq Ft
Est. Value
About This Home
This home is located at 2341 Shining Star Way, Redding, CA 96003 and is currently estimated at $342,910, approximately $207 per square foot. 2341 Shining Star Way is a home located in Shasta County with nearby schools including Shasta Meadows Elementary School, Parsons Junior High School, and Enterprise High School.
Ownership History
Date
Name
Owned For
Owner Type
Purchase Details
Closed on
Sep 20, 2018
Sold by
Vanert John H
Bought by
Vanerl Michelle Anne
Current Estimated Value
Purchase Details
Closed on
Sep 19, 2018
Sold by
West Margie A
Bought by
Vanert Michelle Anne
Purchase Details
Closed on
Apr 18, 2008
Sold by
U S Bank Na
Bought by
West Margie A
Home Financials for this Owner
Home Financials are based on the most recent Mortgage that was taken out on this home.
Original Mortgage
$211,579
Interest Rate
6.11%
Mortgage Type
FHA
Purchase Details
Closed on
Jan 17, 2008
Sold by
Ordona Marlon
Bought by
U S Bank Na
Purchase Details
Closed on
Jul 24, 2006
Sold by
Juntado Elizabeth
Bought by
Ordona Marlon
Home Financials for this Owner
Home Financials are based on the most recent Mortgage that was taken out on this home.
Original Mortgage
$63,800
Interest Rate
6.34%
Mortgage Type
Stand Alone Second
Create a Home Valuation Report for This Property
The Home Valuation Report is an in-depth analysis detailing your home's value as well as a comparison with similar homes in the area
Home Values in the Area
Average Home Value in this Area
Purchase History
| Date | Buyer | Sale Price | Title Company |
|---|---|---|---|
| Vanerl Michelle Anne | -- | Placer Title Co | |
| Vanert Michelle Anne | $240,000 | Placer Title Co | |
| West Margie A | $215,000 | None Available | |
| U S Bank Na | $191,250 | None Available | |
| Ordona Marlon | -- | Placer Title Company | |
| Ordona Marlon | $319,000 | Placer Title Company |
Source: Public Records
Mortgage History
| Date | Status | Borrower | Loan Amount |
|---|---|---|---|
| Previous Owner | West Margie A | $211,579 | |
| Previous Owner | Ordona Marlon | $63,800 | |
| Previous Owner | Ordona Marlon | $255,200 |
Source: Public Records
Tax History
| Year | Tax Paid | Tax Assessment Tax Assessment Total Assessment is a certain percentage of the fair market value that is determined by local assessors to be the total taxable value of land and additions on the property. | Land | Improvement |
|---|---|---|---|---|
| 2025 | $2,974 | $267,720 | $55,774 | $211,946 |
| 2024 | $2,932 | $262,472 | $54,681 | $207,791 |
| 2023 | $2,932 | $257,326 | $53,609 | $203,717 |
| 2022 | $2,848 | $252,281 | $52,558 | $199,723 |
| 2021 | $2,747 | $247,335 | $51,528 | $195,807 |
| 2020 | $2,720 | $244,800 | $51,000 | $193,800 |
| 2019 | $2,706 | $240,000 | $50,000 | $190,000 |
| 2018 | $2,534 | $229,500 | $51,000 | $178,500 |
| 2017 | $2,554 | $225,000 | $50,000 | $175,000 |
| 2016 | $2,361 | $215,000 | $50,000 | $165,000 |
| 2015 | $2,288 | $209,000 | $50,000 | $159,000 |
| 2014 | $2,175 | $197,000 | $45,000 | $152,000 |
Source: Public Records
Map
Nearby Homes
- 2571 Erin Ln
- 2295 Chelsa Cir
- 2093 Victor Ave
- 2728 Jasmine Way
- 1637 French Lace Ln
- 1877 Wheeler St
- 2115 Hawn Ave
- 1701 E Cypress Ave
- 2912 Squire Ave
- 10033 Abernathy Ln
- 1939 Cameo Ct
- 3072 Alta Mesa Dr
- 2935 Snow Fire Ct
- 1461 Oakdale Ln
- 1556 Minor St
- 0 Shasta View Unit 25-1945
- 2906 Regal Ave
- 1090 Gibralter Rd
- 2354 Suzette Ave
- 3361 Alta Mesa Dr
- 2337 Shining Star Way Unit Lot 84
- 2337 Shining Star Way
- 2351 Shining Star Way Unit Lot 90
- 2351 Shining Star Way
- 2333 Shining Star Way Unit Lot 86
- 2333 Shining Star Way
- 2325 Shining Star Way
- 2355 Shining Star Way Unit Lot 91
- 2355 Shining Star Way
- 2347 Shining Star Way Unit Lot 89
- 2347 Shining Star Way
- 2329 Shining Star Way
- 2321 Shining Star Way Unit Lot 82
- 2321 Shining Star Way
- 2367 Shining Star Way
- 2317 Shining Star Way
- 2343 Shining Star Way
- 2313 Shining Star Way
- 2363 Shining Star Way
- 2371 Shining Star Way Unit Lot 93
Your Personal Tour Guide
Ask me questions while you tour the home.