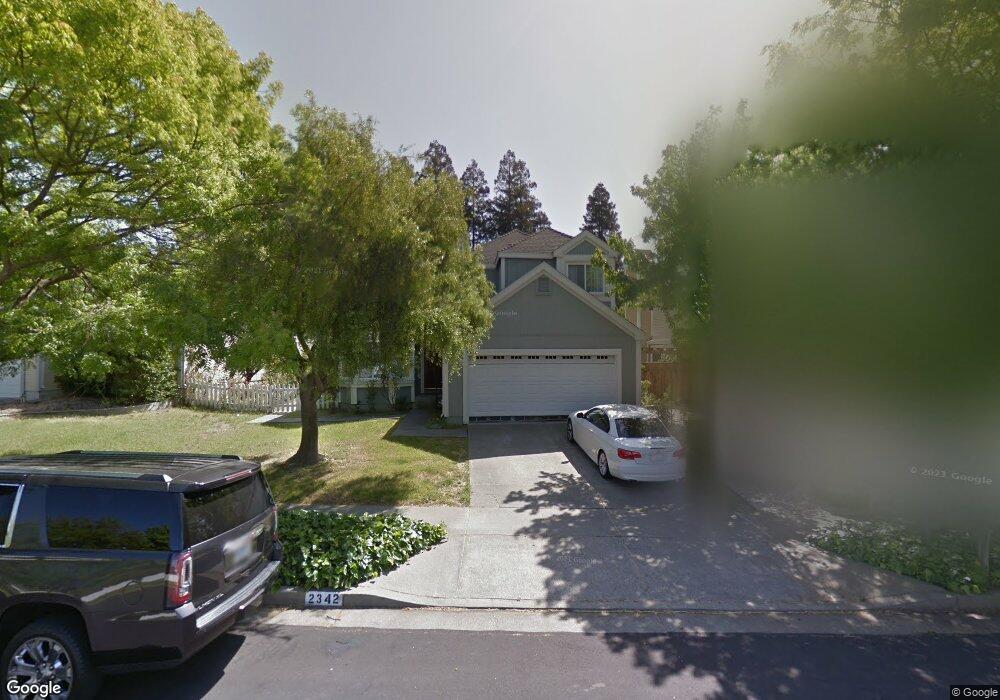
2342 10 Gate Rd Fairfield, CA 94534
Estimated Value: $564,764 - $635,000
3
Beds
3
Baths
1,502
Sq Ft
$395/Sq Ft
Est. Value
About This Home
This home is located at 2342 10 Gate Rd, Fairfield, CA 94534 and is currently estimated at $593,191, approximately $394 per square foot. 2342 10 Gate Rd is a home located in Solano County with nearby schools including K. I. Jones Elementary School, Angelo Rodriguez High School, and Solano Christian Academy.
Ownership History
Date
Name
Owned For
Owner Type
Purchase Details
Closed on
Sep 6, 2017
Sold by
2014-1 Borrower Lp
Bought by
2017-1 Ih Borrower Lp
Current Estimated Value
Purchase Details
Closed on
May 30, 2014
Sold by
Thr California Lp
Bought by
2014-1 Ih Borrower Lp
Home Financials for this Owner
Home Financials are based on the most recent Mortgage that was taken out on this home.
Original Mortgage
$993,738,000
Interest Rate
4.25%
Mortgage Type
Purchase Money Mortgage
Purchase Details
Closed on
Oct 16, 2012
Sold by
Simon James M and Simon Kris A
Bought by
Thr California Lp
Purchase Details
Closed on
Oct 27, 1998
Sold by
Stalians Marilyn K
Bought by
Simon James M and Simon Kris A
Home Financials for this Owner
Home Financials are based on the most recent Mortgage that was taken out on this home.
Original Mortgage
$166,667
Interest Rate
6.6%
Mortgage Type
FHA
Create a Home Valuation Report for This Property
The Home Valuation Report is an in-depth analysis detailing your home's value as well as a comparison with similar homes in the area
Purchase History
| Date | Buyer | Sale Price | Title Company |
|---|---|---|---|
| 2017-1 Ih Borrower Lp | -- | None Available | |
| 2014-1 Ih Borrower Lp | -- | None Available | |
| Thr California Lp | $198,000 | Fidelity Title Co | |
| Simon James M | $170,000 | Fidelity National Title Co |
Source: Public Records
Mortgage History
| Date | Status | Borrower | Loan Amount |
|---|---|---|---|
| Previous Owner | 2014-1 Ih Borrower Lp | $993,738,000 | |
| Previous Owner | Simon James M | $166,667 | |
| Closed | Simon James M | $8,333 |
Source: Public Records
Tax History
| Year | Tax Paid | Tax Assessment Tax Assessment Total Assessment is a certain percentage of the fair market value that is determined by local assessors to be the total taxable value of land and additions on the property. | Land | Improvement |
|---|---|---|---|---|
| 2025 | $5,124 | $441,017 | $116,056 | $324,961 |
| 2024 | $5,124 | $432,371 | $113,781 | $318,590 |
| 2023 | $4,972 | $423,894 | $111,550 | $312,344 |
| 2022 | $4,914 | $415,583 | $109,363 | $306,220 |
| 2021 | $4,868 | $407,435 | $107,219 | $300,216 |
| 2020 | $4,758 | $403,258 | $106,120 | $297,138 |
| 2019 | $4,646 | $395,352 | $104,040 | $291,312 |
| 2018 | $4,790 | $387,600 | $102,000 | $285,600 |
| 2017 | $2,802 | $224,938 | $63,661 | $161,277 |
| 2016 | $2,779 | $220,528 | $62,413 | $158,115 |
| 2015 | $2,607 | $217,216 | $61,476 | $155,740 |
| 2014 | $2,585 | $212,962 | $60,272 | $152,690 |
Source: Public Records
Map
Nearby Homes
- 2545 Vista Grande
- 2795 Vista Palomar
- 2707 Tuckaway Ct
- 2051 Barbour Dr
- 58 Del Prado Cir
- 3127 Cherry Valley Cir
- 2326 Cunningham Dr
- 45 Goya Dr
- 1301 Sunningdale Ln
- 120 Goya Dr
- 41 Goya Dr
- 2848 Howe Ct
- 15 Dali Ct
- 2611 Lilac St
- 413 Violet Ct
- 1706 Barton Dr
- 3114 Lomita Ct
- 883 Inverness Ct
- 2034 Cambridge Dr
- 3227 Balmoral Ct
Your Personal Tour Guide
Ask me questions while you tour the home.