Estimated Value: $771,000 - $805,000
4
Beds
4
Baths
3,000
Sq Ft
$263/Sq Ft
Est. Value
About This Home
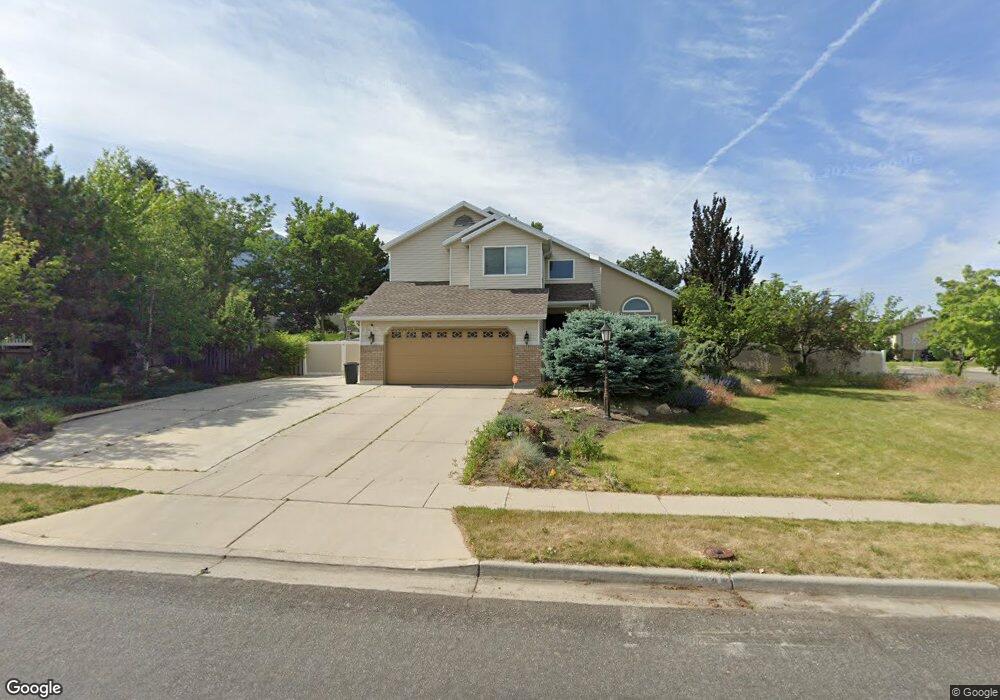
This home is located at 2342 Karalee Way, Sandy, UT 84092 and is currently estimated at $788,698, approximately $262 per square foot. 2342 Karalee Way is a home located in Salt Lake County with nearby schools including Park Lane Elementary School, Eastmont Middle School, and Jordan High.
Ownership History
Date
Name
Owned For
Owner Type
Purchase Details
Closed on
Nov 5, 2025
Sold by
Trayner Niki
Bought by
Colosimo Dominic Anthony
Current Estimated Value
Home Financials for this Owner
Home Financials are based on the most recent Mortgage that was taken out on this home.
Original Mortgage
$582,750
Outstanding Balance
$582,750
Interest Rate
6.3%
Mortgage Type
Construction
Estimated Equity
$205,948
Purchase Details
Closed on
Oct 21, 2019
Sold by
Jones Joe E
Bought by
Trayner Niki
Home Financials for this Owner
Home Financials are based on the most recent Mortgage that was taken out on this home.
Original Mortgage
$294,744
Interest Rate
3.5%
Mortgage Type
New Conventional
Purchase Details
Closed on
Feb 9, 2017
Sold by
Jones Joe
Bought by
Jones Joe E and Trayner Niki
Home Financials for this Owner
Home Financials are based on the most recent Mortgage that was taken out on this home.
Original Mortgage
$155,000
Interest Rate
4.32%
Mortgage Type
New Conventional
Purchase Details
Closed on
Jan 25, 2008
Sold by
Jones Joe E
Bought by
Jones Joe E and Trayner Niki
Home Financials for this Owner
Home Financials are based on the most recent Mortgage that was taken out on this home.
Original Mortgage
$245,000
Interest Rate
6.09%
Mortgage Type
New Conventional
Purchase Details
Closed on
Oct 31, 2002
Sold by
Prehm William L and Prehm Kellyn Lee
Bought by
Jones Joe E
Home Financials for this Owner
Home Financials are based on the most recent Mortgage that was taken out on this home.
Original Mortgage
$225,000
Interest Rate
5.99%
Purchase Details
Closed on
Mar 6, 2001
Sold by
Feinman Barry J and Feinman Cynthia
Bought by
Prehm William L
Home Financials for this Owner
Home Financials are based on the most recent Mortgage that was taken out on this home.
Original Mortgage
$168,000
Interest Rate
7.12%
Purchase Details
Closed on
Mar 5, 2001
Sold by
Prehm William L
Bought by
Prehm William L and Prehm Kellyn Lee
Home Financials for this Owner
Home Financials are based on the most recent Mortgage that was taken out on this home.
Original Mortgage
$168,000
Interest Rate
7.12%
Purchase Details
Closed on
May 18, 1994
Sold by
Boersma Donald E and Boersma Bernadine A
Bought by
Feinman Barry J and Feinman Cynthia
Home Financials for this Owner
Home Financials are based on the most recent Mortgage that was taken out on this home.
Original Mortgage
$79,900
Interest Rate
8.52%
Purchase Details
Closed on
Dec 23, 1993
Sold by
Rasmussen Jay D and Rasmussen Lisa K
Bought by
Boersma Donald E and Boersma Bernadine A
Home Financials for this Owner
Home Financials are based on the most recent Mortgage that was taken out on this home.
Original Mortgage
$124,000
Interest Rate
7.09%
Create a Home Valuation Report for This Property
The Home Valuation Report is an in-depth analysis detailing your home's value as well as a comparison with similar homes in the area
Home Values in the Area
Average Home Value in this Area
Purchase History
| Date | Buyer | Sale Price | Title Company |
|---|---|---|---|
| Colosimo Dominic Anthony | -- | Onrecord Title | |
| Trayner Niki | -- | Title Guarantee Fort Union | |
| Jones Joe E | -- | First American Title | |
| Jones Joe | -- | First American Title | |
| Jones Joe E | -- | Title One | |
| Jones Joe E | -- | Inwest Title Services | |
| Prehm William L | -- | Guardian Title | |
| Prehm William L | -- | Guardian Title | |
| Feinman Barry J | -- | -- | |
| Boersma Donald E | -- | -- |
Source: Public Records
Mortgage History
| Date | Status | Borrower | Loan Amount |
|---|---|---|---|
| Open | Colosimo Dominic Anthony | $582,750 | |
| Previous Owner | Trayner Niki | $294,744 | |
| Previous Owner | Jones Joe | $155,000 | |
| Previous Owner | Jones Joe E | $245,000 | |
| Previous Owner | Jones Joe E | $225,000 | |
| Previous Owner | Prehm William L | $168,000 | |
| Previous Owner | Feinman Barry J | $79,900 | |
| Previous Owner | Boersma Donald E | $124,000 | |
| Closed | Prehm William L | $31,500 |
Source: Public Records
Tax History
| Year | Tax Paid | Tax Assessment Tax Assessment Total Assessment is a certain percentage of the fair market value that is determined by local assessors to be the total taxable value of land and additions on the property. | Land | Improvement |
|---|---|---|---|---|
| 2025 | $4,029 | $775,700 | $306,000 | $469,700 |
| 2024 | $4,029 | $755,200 | $294,600 | $460,600 |
| 2023 | $3,820 | $714,700 | $283,300 | $431,400 |
| 2022 | $3,709 | $682,700 | $277,800 | $404,900 |
| 2021 | $3,315 | $519,500 | $222,200 | $297,300 |
| 2020 | $3,165 | $468,000 | $222,200 | $245,800 |
| 2019 | $3,061 | $441,700 | $212,400 | $229,300 |
| 2018 | $2,785 | $420,200 | $212,400 | $207,800 |
| 2017 | $2,572 | $371,200 | $212,400 | $158,800 |
| 2016 | $2,482 | $346,300 | $191,400 | $154,900 |
| 2015 | $2,647 | $342,400 | $202,900 | $139,500 |
| 2014 | $2,566 | $326,100 | $197,100 | $129,000 |
Source: Public Records
Map
Nearby Homes
- 2111 Glacier View Dr
- 9942 S Altamont Dr
- 2067 E Gyrfalcon Ln
- 2103 Kramer Dr
- 2009 E Sweetbriar Ln
- 10665 S 2340 E
- 2724 Mount Jordan Rd
- 9650 S Buttonwood Dr
- 1 Pepperwood Pointe
- 5 Quietwood Ln
- 1952 E Bluffside Cir
- 16 Gatehouse Ln
- 10175 S Dimple Dell Rd
- 10279 S Dimple Dell Rd E Unit 103
- 9673 Chylene Dr
- 39 Northridge Way
- 10804 S Hiddenwood Dr
- 9623 Tannenbaum Cove
- 3149 E 10000 S
- 10158 Buttercup Dr
- 2354 Karalee Way
- 2354 E Karalee Way
- 2341 Karalee Way
- 10209 S Eastdell Dr
- 10209 Eastdell Dr
- 2355 Karalee Way
- 2341 E Karalee Way
- 2366 Karalee Way
- 2361 Glacier View Dr
- 2361 E 10225 S
- 2373 E Glacier View Dr
- 2373 Glacier View Dr
- 2373 E 10225 S
- 10219 S Eastdell Dr
- 10219 Eastdell Dr
- 2318 Karalee Way
- 10156 Abbey Ridge Ln
- 10156 Abbey Ridge Ln Unit 5
- 2380 Karalee Way
- 10208 Eastdell Dr