2344 Walden Square San Jose, CA 95124
Willow Glen NeighborhoodEstimated Value: $2,429,874 - $2,703,000
4
Beds
3
Baths
2,364
Sq Ft
$1,070/Sq Ft
Est. Value
About This Home
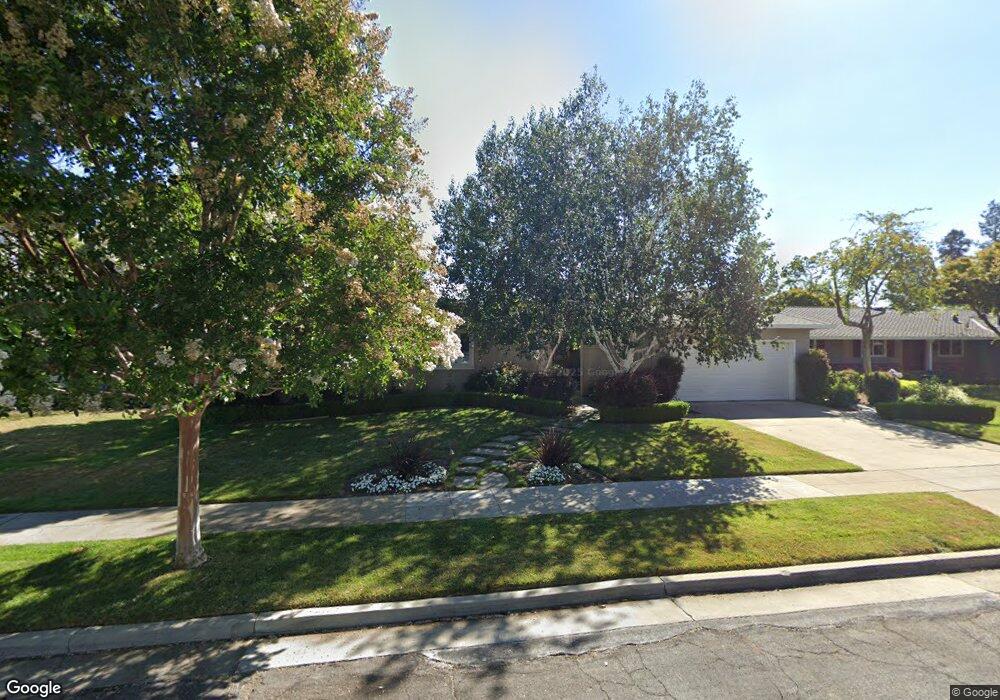
This home is located at 2344 Walden Square, San Jose, CA 95124 and is currently estimated at $2,530,219, approximately $1,070 per square foot. 2344 Walden Square is a home located in Santa Clara County with nearby schools including Booksin Elementary, Willow Glen Middle, and Willow Glen High School.
Ownership History
Date
Name
Owned For
Owner Type
Purchase Details
Closed on
Dec 8, 2017
Sold by
Myers Jean C and The 200 Lanny B Myers And Jean
Bought by
Myers Jean C and The Jean C Myers Revocable Tru
Current Estimated Value
Purchase Details
Closed on
Feb 20, 2016
Sold by
Myers Jean C
Bought by
Myers Jean C
Home Financials for this Owner
Home Financials are based on the most recent Mortgage that was taken out on this home.
Original Mortgage
$224,000
Interest Rate
3.92%
Mortgage Type
New Conventional
Purchase Details
Closed on
Jun 1, 2006
Sold by
Myers Jean C
Bought by
Myers Jean C
Purchase Details
Closed on
Jan 31, 2002
Sold by
Myers Jean C
Bought by
Myers Jean C
Purchase Details
Closed on
Oct 1, 2000
Sold by
Myers Lanny B and Myers Jean M
Bought by
Myers Lanny B and Myers Jean M
Create a Home Valuation Report for This Property
The Home Valuation Report is an in-depth analysis detailing your home's value as well as a comparison with similar homes in the area
Home Values in the Area
Average Home Value in this Area
Purchase History
| Date | Buyer | Sale Price | Title Company |
|---|---|---|---|
| Myers Jean C | -- | None Available | |
| Myers Jean C | -- | Tsi Title Company Spl | |
| Myers Jean C | -- | None Available | |
| Myers Jean C | -- | -- | |
| Myers Lanny B | -- | -- |
Source: Public Records
Mortgage History
| Date | Status | Borrower | Loan Amount |
|---|---|---|---|
| Closed | Myers Jean C | $224,000 |
Source: Public Records
Tax History Compared to Growth
Tax History
| Year | Tax Paid | Tax Assessment Tax Assessment Total Assessment is a certain percentage of the fair market value that is determined by local assessors to be the total taxable value of land and additions on the property. | Land | Improvement |
|---|---|---|---|---|
| 2025 | $4,192 | $230,986 | $46,181 | $184,805 |
| 2024 | $4,192 | $226,458 | $45,276 | $181,182 |
| 2023 | $4,192 | $222,019 | $44,389 | $177,630 |
| 2022 | $4,025 | $217,667 | $43,519 | $174,148 |
| 2021 | $3,889 | $213,400 | $42,666 | $170,734 |
| 2020 | $3,760 | $211,213 | $42,229 | $168,984 |
| 2019 | $3,654 | $207,072 | $41,401 | $165,671 |
| 2018 | $3,595 | $203,013 | $40,590 | $162,423 |
| 2017 | $3,635 | $199,034 | $39,795 | $159,239 |
| 2016 | $3,493 | $195,132 | $39,015 | $156,117 |
| 2015 | $3,457 | $192,201 | $38,429 | $153,772 |
| 2014 | $2,980 | $188,437 | $37,677 | $150,760 |
Source: Public Records
Map
Nearby Homes
- 1791 Frobisher Way
- 2322 Meridian Ave
- 1736 Frobisher Way
- 1831 Frobisher Way
- 2498 Raleigh Dr
- 2538 Custer Dr
- 2514 Meridian Ave
- 1741 Harte Dr
- 1705 Harte Dr
- 2425 Briarwood Dr
- 2536 Malaga Dr
- 1829 Cabana Dr
- 1500 E Campbell Ave
- 2772 Quinto Way
- 1870 Patio Dr
- 2751 Coit Dr
- 1665 Fairorchard Ave
- 1898 Meridian Ave Unit 29
- 2020 James Place
- 1959 Schrader Dr
- 2348 Walden Square
- 2340 Walden Square
- 2347 Heritage Ct
- 2351 Heritage Ct
- 2352 Walden Square
- 2336 Walden Square
- 2343 Heritage Ct
- 2345 Walden Square
- 2341 Walden Square
- 2349 Walden Square
- 2337 Walden Square
- 2355 Heritage Ct
- 2316 Walden Square
- 2376 Walden Square
- 2310 Walden Square
- 2339 Heritage Ct
- 2353 Walden Square
- 2333 Walden Square
- 2306 Walden Square
- 2359 Heritage Ct