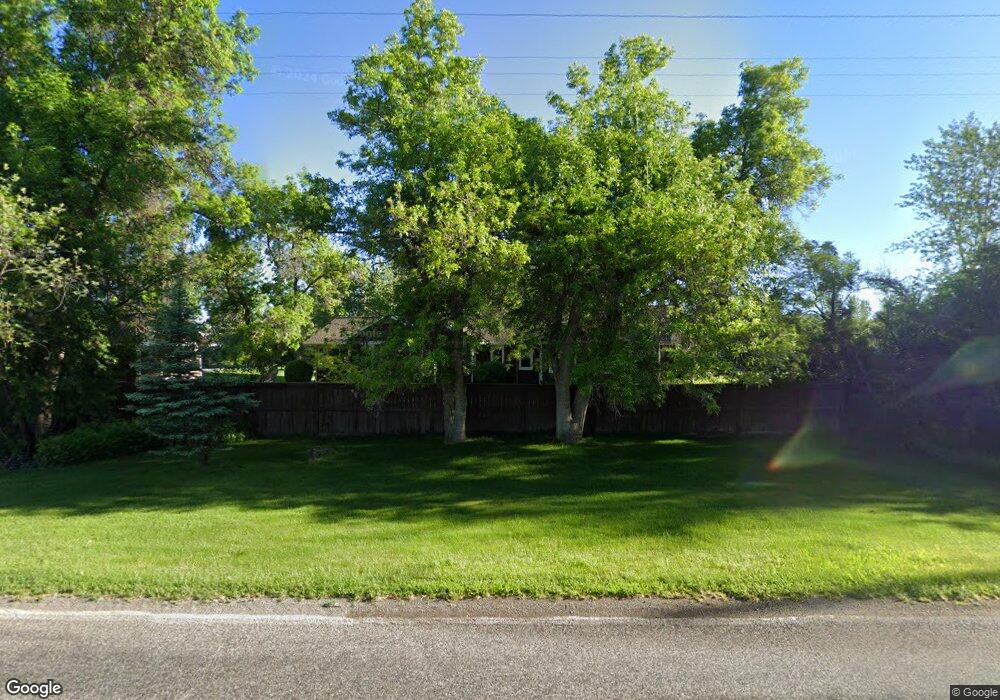
2345 W Cameron Bridge Rd Bozeman, MT 59718
Estimated Value: $909,000 - $1,729,784
3
Beds
2
Baths
2,466
Sq Ft
$565/Sq Ft
Est. Value
About This Home
This home is located at 2345 W Cameron Bridge Rd, Bozeman, MT 59718 and is currently estimated at $1,392,595, approximately $564 per square foot. 2345 W Cameron Bridge Rd is a home located in Gallatin County with nearby schools including Ridge View Elementary School, Belgrade High School, and Hearts & Hands Montessori School.
Ownership History
Date
Name
Owned For
Owner Type
Purchase Details
Closed on
Jun 1, 2017
Sold by
Hauge Pamela S
Bought by
Wilkerson Steven and Wilkerson Sandra
Current Estimated Value
Home Financials for this Owner
Home Financials are based on the most recent Mortgage that was taken out on this home.
Original Mortgage
$424,000
Outstanding Balance
$352,196
Interest Rate
3.97%
Mortgage Type
New Conventional
Estimated Equity
$1,040,399
Purchase Details
Closed on
Oct 3, 2005
Sold by
Lehfeldt Diana Hoffman
Bought by
Rapp Thomas E
Home Financials for this Owner
Home Financials are based on the most recent Mortgage that was taken out on this home.
Original Mortgage
$460,000
Interest Rate
5.72%
Mortgage Type
Fannie Mae Freddie Mac
Create a Home Valuation Report for This Property
The Home Valuation Report is an in-depth analysis detailing your home's value as well as a comparison with similar homes in the area
Home Values in the Area
Average Home Value in this Area
Purchase History
| Date | Buyer | Sale Price | Title Company |
|---|---|---|---|
| Wilkerson Steven | -- | Montana Title & Escrow | |
| Rapp Thomas E | -- | American Land Title Company |
Source: Public Records
Mortgage History
| Date | Status | Borrower | Loan Amount |
|---|---|---|---|
| Open | Wilkerson Steven | $424,000 | |
| Previous Owner | Rapp Thomas E | $460,000 |
Source: Public Records
Tax History Compared to Growth
Tax History
| Year | Tax Paid | Tax Assessment Tax Assessment Total Assessment is a certain percentage of the fair market value that is determined by local assessors to be the total taxable value of land and additions on the property. | Land | Improvement |
|---|---|---|---|---|
| 2025 | $5,761 | $1,310,895 | $0 | $0 |
| 2024 | $6,993 | $1,155,600 | $0 | $0 |
| 2023 | $6,966 | $1,155,600 | $0 | $0 |
| 2022 | $6,167 | $822,845 | $0 | $0 |
| 2021 | $6,531 | $822,845 | $0 | $0 |
| 2020 | $5,229 | $652,400 | $0 | $0 |
| 2019 | $5,325 | $652,400 | $0 | $0 |
| 2018 | $4,854 | $560,802 | $0 | $0 |
| 2017 | $4,112 | $519,800 | $0 | $0 |
| 2016 | $3,036 | $435,100 | $0 | $0 |
| 2015 | $3,166 | $435,100 | $0 | $0 |
| 2014 | $4,064 | $294,191 | $0 | $0 |
Source: Public Records
Map
Nearby Homes
- 2444 W Cameron Bridge Rd
- 4752 Eden Rd
- 624 Rocking Horse Dr
- NHN River Rd
- 1733 W Cameron Bridge Rd
- 4533 Linney Rd Unit 4565 + 4455
- 164 Wapiti Way
- 57 and 47 Green Meadow Way
- 1202 Ludwig Ln
- 3455 Linney Rd
- 5350 River Rd
- 2521 Weaver Ln
- 680 Countryside Ln
- 94 Grassy Meadow Dr
- TBD Weaver Ln
- 478 Pacer Landing
- 1385 Baldy Mountain Ln
- TBD Lot 15A Riverway Rd
- Lot 15 A TBD Riverway Rd
- Lot 3 Baldy Mountain Ln
- 2235 W Cameron Bridge Rd
- 4150 River Rd
- 2200 W Cameron Bridge Rd
- 4200 River Rd
- 0 Lot 4 River Rd Unit 377527
- 2582 W Cameron Bridge Rd
- 4175 River Rd
- 2065 W Cameron Bridge Rd
- 4117 River Rd
- 294 Rocking Horse Dr
- 2000 W Cameron Bridge Rd
- 2055 W Cameron Bridge Rd
- 430 Rocking Horse Dr
- 4774 Eden Rd
- TBD Rockinghorse Dr
- 4830 Eden Rd
- 4830 Eden Rd Unit Bozeman
- 226 Rocking Horse Dr
- 4700 Eden Rd
- 4430 River Rd