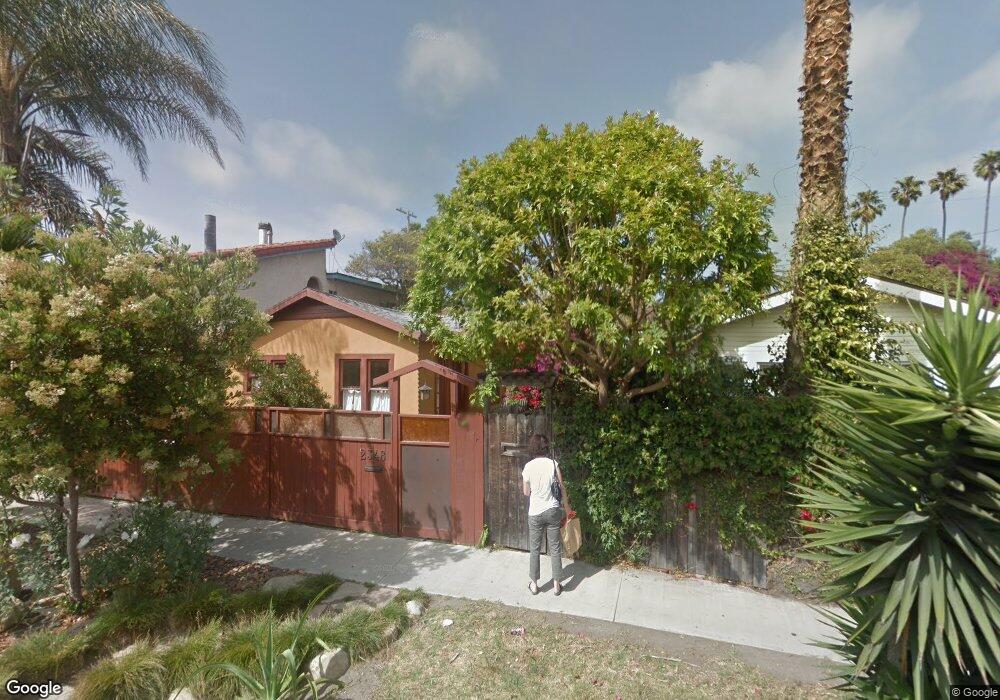
2348 Ocean Ave Venice, CA 90291
Venice NeighborhoodEstimated Value: $1,167,092 - $1,749,000
2
Beds
1
Bath
426
Sq Ft
$3,465/Sq Ft
Est. Value
About This Home
This home is located at 2348 Ocean Ave, Venice, CA 90291 and is currently estimated at $1,476,273, approximately $3,465 per square foot. 2348 Ocean Ave is a home located in Los Angeles County with nearby schools including Coeur D'Alene Avenue Elementary School, Mark Twain Middle School, and Venice High School.
Ownership History
Date
Name
Owned For
Owner Type
Purchase Details
Closed on
Oct 23, 2002
Sold by
Jenkins Heide A and Heide Jenkins Trust
Bought by
Maloney Kevin and Humphrey Donna
Current Estimated Value
Home Financials for this Owner
Home Financials are based on the most recent Mortgage that was taken out on this home.
Original Mortgage
$387,200
Interest Rate
5.5%
Purchase Details
Closed on
Dec 18, 2000
Sold by
Jenkins Heide A
Bought by
Jenkins Heide and Heide Jenkins Trust
Purchase Details
Closed on
Mar 16, 1994
Sold by
Resolution Trust Corp
Bought by
Jenkins Heide A
Home Financials for this Owner
Home Financials are based on the most recent Mortgage that was taken out on this home.
Original Mortgage
$108,750
Interest Rate
3.75%
Purchase Details
Closed on
Nov 15, 1993
Sold by
G S L Financial Corp
Bought by
Guardian Federal Svgs Assn Fa and Guardian S&L Assn
Create a Home Valuation Report for This Property
The Home Valuation Report is an in-depth analysis detailing your home's value as well as a comparison with similar homes in the area
Home Values in the Area
Average Home Value in this Area
Purchase History
| Date | Buyer | Sale Price | Title Company |
|---|---|---|---|
| Maloney Kevin | $484,000 | Chicago | |
| Jenkins Heide | -- | -- | |
| Jenkins Heide A | -- | Fidelity National Title | |
| Guardian Federal Svgs Assn Fa | $120,986 | World Title Company |
Source: Public Records
Mortgage History
| Date | Status | Borrower | Loan Amount |
|---|---|---|---|
| Previous Owner | Maloney Kevin | $387,200 | |
| Previous Owner | Jenkins Heide A | $108,750 | |
| Closed | Maloney Kevin | $48,400 |
Source: Public Records
Tax History
| Year | Tax Paid | Tax Assessment Tax Assessment Total Assessment is a certain percentage of the fair market value that is determined by local assessors to be the total taxable value of land and additions on the property. | Land | Improvement |
|---|---|---|---|---|
| 2025 | $8,385 | $700,970 | $560,786 | $140,184 |
| 2024 | $8,385 | $687,227 | $549,791 | $137,436 |
| 2023 | $8,225 | $673,753 | $539,011 | $134,742 |
| 2022 | $7,843 | $660,543 | $528,443 | $132,100 |
| 2021 | $7,749 | $647,592 | $518,082 | $129,510 |
| 2019 | $7,517 | $628,386 | $502,716 | $125,670 |
| 2018 | $7,475 | $616,065 | $492,859 | $123,206 |
| 2016 | $7,158 | $592,145 | $473,722 | $118,423 |
| 2015 | $7,053 | $583,252 | $466,607 | $116,645 |
| 2014 | $7,081 | $571,828 | $457,467 | $114,361 |
Source: Public Records
Map
Nearby Homes
- 2354 Ocean Ave
- 2412 Ocean Ave Unit 4
- 2412 Ocean Ave Unit 2
- 2301 Eastern Canal
- 2504 Ocean Ave
- 427 Sherman Canal
- 547 28th Ave
- 442 Sherman Canal
- 415 Sherman Canal
- 657 Mildred Ave
- 419 Carroll Canal
- 544 Grand Blvd
- 510 Venice Way
- 2904 Beach Ave
- 505 Venice Way
- 224 Linnie Canal
- 620 Harbor St Unit 6
- 225 Carroll Canal
- 230 Sherman Canal
- 2300 Grand Canal
- 2352 Ocean Ave
- 2344 Ocean Ave
- 2340 Ocean Ave
- 2362 Ocean Ave
- 2336 Ocean Ave
- 2360 Ocean Ave
- 2345 Beach Ave
- 2349 Beach Ave
- 2341 Beach Ave Unit 1/2
- 2341 Beach Ave Unit 3/4
- 2341 Beach Ave Unit 2341 1/2
- 2341 Beach Ave Unit 2341 3/4
- 2341 Beach Ave
- 2353 Beach Ave
- 2337 Beach Ave
- 2357 Beach Ave
- 2333 Beach Ave
- 2339 Ocean Ave Unit B
- 2339 Ocean Ave
- 2339 Ocean Ave
Your Personal Tour Guide
Ask me questions while you tour the home.