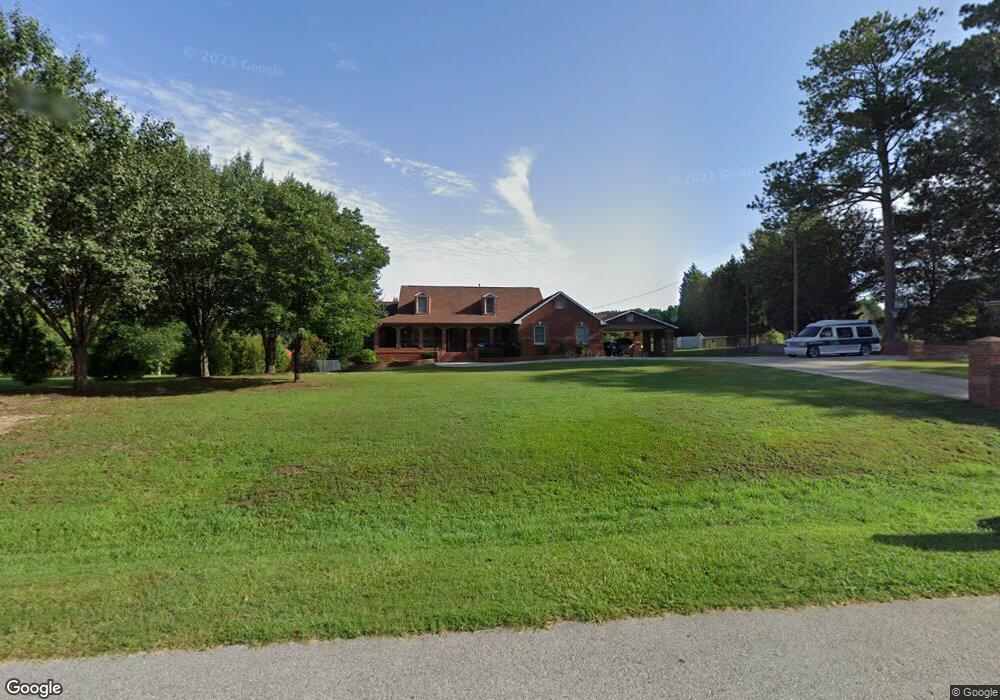
235 David Larsen Dr Stockbridge, GA 30281
Estimated Value: $381,158 - $432,000
4
Beds
2
Baths
3,088
Sq Ft
$134/Sq Ft
Est. Value
About This Home
This home is located at 235 David Larsen Dr, Stockbridge, GA 30281 and is currently estimated at $414,290, approximately $134 per square foot. 235 David Larsen Dr is a home located in Henry County with nearby schools including Woodland Elementary School, Woodland Middle School, and Woodland High School.
Ownership History
Date
Name
Owned For
Owner Type
Purchase Details
Closed on
Mar 23, 2006
Sold by
Thompson Billy F and Thompson Mary E
Bought by
Sanchez Jose C and Sanchez Alma
Current Estimated Value
Home Financials for this Owner
Home Financials are based on the most recent Mortgage that was taken out on this home.
Original Mortgage
$39,180
Outstanding Balance
$22,307
Interest Rate
6.2%
Mortgage Type
Unknown
Estimated Equity
$391,983
Purchase Details
Closed on
Dec 30, 1993
Sold by
T W Prop
Bought by
Thompson Billy A
Home Financials for this Owner
Home Financials are based on the most recent Mortgage that was taken out on this home.
Original Mortgage
$121,750
Interest Rate
7.5%
Mortgage Type
VA
Create a Home Valuation Report for This Property
The Home Valuation Report is an in-depth analysis detailing your home's value as well as a comparison with similar homes in the area
Home Values in the Area
Average Home Value in this Area
Purchase History
| Date | Buyer | Sale Price | Title Company |
|---|---|---|---|
| Sanchez Jose C | $195,900 | -- | |
| Thompson Billy A | $118,500 | -- |
Source: Public Records
Mortgage History
| Date | Status | Borrower | Loan Amount |
|---|---|---|---|
| Open | Sanchez Jose C | $39,180 | |
| Open | Sanchez Jose C | $156,720 | |
| Previous Owner | Thompson Billy A | $121,750 |
Source: Public Records
Tax History Compared to Growth
Tax History
| Year | Tax Paid | Tax Assessment Tax Assessment Total Assessment is a certain percentage of the fair market value that is determined by local assessors to be the total taxable value of land and additions on the property. | Land | Improvement |
|---|---|---|---|---|
| 2025 | $6,333 | $179,840 | $18,000 | $161,840 |
| 2024 | $6,333 | $157,960 | $18,000 | $139,960 |
| 2023 | $5,855 | $151,600 | $16,000 | $135,600 |
| 2022 | $5,107 | $132,080 | $14,000 | $118,080 |
| 2021 | $4,339 | $112,080 | $14,000 | $98,080 |
| 2020 | $3,933 | $101,480 | $10,000 | $91,480 |
| 2019 | $3,976 | $102,600 | $10,000 | $92,600 |
| 2018 | $3,957 | $102,120 | $10,000 | $92,120 |
| 2016 | $3,638 | $93,800 | $10,000 | $83,800 |
| 2015 | $3,221 | $80,440 | $10,000 | $70,440 |
| 2014 | $3,043 | $75,040 | $6,800 | $68,240 |
Source: Public Records
Map
Nearby Homes
- 2100 Highway 138 E
- 157 Hambrick Dr
- 0 E Mays Rd Unit 10496305
- 88 Bowen Rd
- 120 Bowen Rd
- 373 Vicki Ln
- 5339 Highway 155 N
- 5149 Highway 155 N
- 2471 Old Conyers Rd
- 3710 Highway 155 SW
- 0 Georgia 155 S Unit TRACT 3 10311477
- 5018 Highway 155 N
- 641 Morningside Dr N
- 4881 Highway 155 N
- 222 Hemlock Dr
- 214 Hemlock Dr
- 106 Valley Rd
- 0 Valley Rd & Hwy 155 Rd
- 225 David Larsen Dr
- 245 David Larsen Dr
- 255 David Larsen Dr
- 205 David Larsen Dr
- 230 David Larsen Dr
- 226 David Larsen Dr
- 265 David Larsen Dr
- 236 David Larsen Dr
- 0 David Larsen Dr Unit 8436404
- 0 David Larsen Dr Unit 8219065
- 0 David Larsen Dr Unit 8130436
- 0 David Larsen Dr Unit 8078082
- 267 David Larsen Dr
- 195 Brooks Dr
- 189 Brooks Dr
- 218 David Larsen Dr
- 246 David Larsen Dr
- 205 Brooks Dr
- 250 David Larsen Dr
- 210 David Larsen Dr