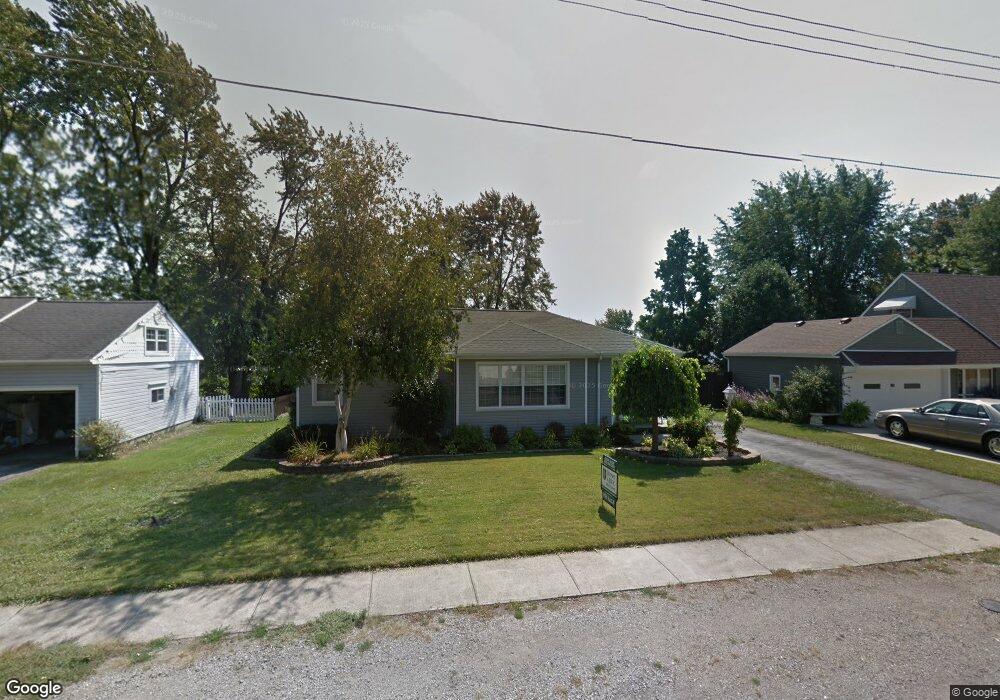
235 Elizabeth Ave Findlay, OH 45840
Estimated Value: $182,000 - $198,367
2
Beds
2
Baths
1,525
Sq Ft
$126/Sq Ft
Est. Value
About This Home
This home is located at 235 Elizabeth Ave, Findlay, OH 45840 and is currently estimated at $192,092, approximately $125 per square foot. 235 Elizabeth Ave is a home located in Hancock County with nearby schools including Northview Elementary School, Bigelow Hill Elementary School, and Glenwood Middle School.
Ownership History
Date
Name
Owned For
Owner Type
Purchase Details
Closed on
Apr 26, 2016
Sold by
Wolford Nathan
Bought by
Sheeter Andrea R
Current Estimated Value
Home Financials for this Owner
Home Financials are based on the most recent Mortgage that was taken out on this home.
Original Mortgage
$91,575
Outstanding Balance
$72,518
Interest Rate
3.5%
Mortgage Type
FHA
Estimated Equity
$119,574
Purchase Details
Closed on
Apr 19, 2004
Sold by
Washington Mutual Bank Fa
Bought by
Wolford Nathan
Home Financials for this Owner
Home Financials are based on the most recent Mortgage that was taken out on this home.
Original Mortgage
$72,400
Interest Rate
5.63%
Mortgage Type
Purchase Money Mortgage
Purchase Details
Closed on
Jan 6, 2004
Sold by
Schimmoeller Marvin C
Bought by
Washington Mutual Bank Fa
Purchase Details
Closed on
May 1, 1996
Sold by
Stober Roberta
Bought by
Schimmoeller Marvin and Schimmoeller Loretta
Purchase Details
Closed on
Aug 22, 1983
Bought by
Stober Dortha W and Stober Roberta
Purchase Details
Closed on
Jul 22, 1983
Bought by
Friend Elva C
Create a Home Valuation Report for This Property
The Home Valuation Report is an in-depth analysis detailing your home's value as well as a comparison with similar homes in the area
Home Values in the Area
Average Home Value in this Area
Purchase History
| Date | Buyer | Sale Price | Title Company |
|---|---|---|---|
| Sheeter Andrea R | $100,000 | Mid Am Title | |
| Wolford Nathan | $90,500 | Kings Title & Closing Svcs | |
| Washington Mutual Bank Fa | $86,000 | Whitman Title | |
| Schimmoeller Marvin | $81,000 | -- | |
| Stober Dortha W | $45,000 | -- | |
| Friend Elva C | -- | -- |
Source: Public Records
Mortgage History
| Date | Status | Borrower | Loan Amount |
|---|---|---|---|
| Open | Sheeter Andrea R | $91,575 | |
| Previous Owner | Wolford Nathan | $72,400 |
Source: Public Records
Tax History Compared to Growth
Tax History
| Year | Tax Paid | Tax Assessment Tax Assessment Total Assessment is a certain percentage of the fair market value that is determined by local assessors to be the total taxable value of land and additions on the property. | Land | Improvement |
|---|---|---|---|---|
| 2024 | $1,722 | $48,470 | $5,760 | $42,710 |
| 2023 | $1,724 | $48,470 | $5,760 | $42,710 |
| 2022 | $1,726 | $48,470 | $5,760 | $42,710 |
| 2021 | $1,524 | $37,440 | $5,750 | $31,690 |
| 2020 | $1,524 | $37,440 | $5,750 | $31,690 |
| 2019 | $1,631 | $37,440 | $5,750 | $31,690 |
| 2018 | $1,525 | $32,550 | $5,000 | $27,550 |
| 2017 | $1,415 | $32,550 | $5,000 | $27,550 |
| 2016 | $1,402 | $32,550 | $5,000 | $27,550 |
| 2015 | $1,491 | $34,100 | $5,000 | $29,100 |
| 2014 | $1,491 | $34,100 | $5,000 | $29,100 |
| 2012 | $1,375 | $31,220 | $5,000 | $26,220 |
Source: Public Records
Map
Nearby Homes
- 304 Prentiss Ave
- 1934 Geffs Ave
- 304 Rector Ave
- 1820 N Main St
- 405 Clifton Ave
- 643 Edith Ave
- 2100 Candlewick Dr
- 410 Monroe Ave
- 1825 Pershing St
- 128 Harrington Ave
- 231 Tioga Ave
- 905 W Melrose Ave
- 506 Hillcrest Ave
- 126 Hillcrest Ave
- 615 Hillcrest Ave
- 925 W Melrose Ave
- 600 Charles Ave
- 334 E Foulke Ave
- 933 Laurel Ln
- 1908 Gayle Ln
- 235 Elizabeth St
- 231 Elizabeth Ave
- 231 Elizabeth St
- 301 Elizabeth St
- 236 W Melrose Ave
- 227 Elizabeth St
- 232 W Melrose Ave
- 234 Elizabeth Ave
- 300 W Melrose Ave
- 234 Elizabeth St
- 303 Elizabeth Ave
- 303 Elizabeth St
- 300 Elizabeth Ave
- 230 Elizabeth St
- 300 Elizabeth St
- 306 W Melrose Ave
- 226 Elizabeth Ave
- 226 Elizabeth St
- 306 Elizabeth St
- 307 Elizabeth Ave