Estimated Value: $1,727,767 - $2,179,000
4
Beds
4
Baths
3,386
Sq Ft
$565/Sq Ft
Est. Value
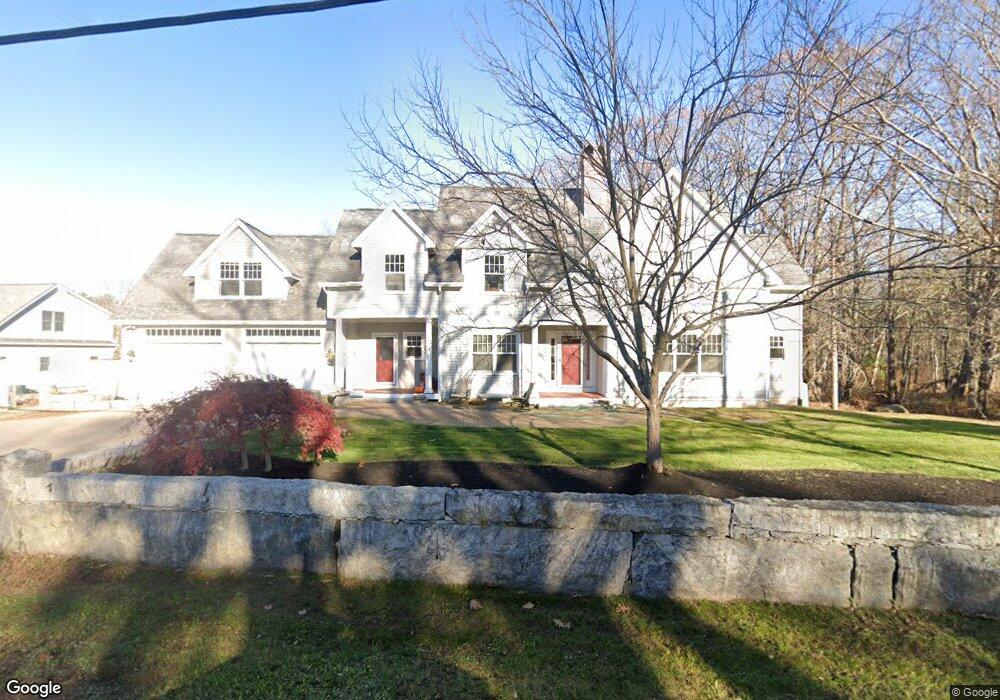
About This Home
This home is located at 235 Parsons Rd, Rye, NH 03870 and is currently estimated at $1,911,442, approximately $564 per square foot. 235 Parsons Rd is a home located in Rockingham County with nearby schools including Rye Elementary School, Rye Junior High School, and St Patrick School.
Ownership History
Date
Name
Owned For
Owner Type
Purchase Details
Closed on
Mar 4, 2025
Sold by
Klatt Christine A
Bought by
Christine A Carberry Ret and Klatt
Current Estimated Value
Purchase Details
Closed on
Jul 13, 2016
Sold by
Carberry Timothy G
Bought by
Timothy G Carberry Ret and Carberry
Purchase Details
Closed on
Dec 1, 1993
Bought by
Carberry Timothy George
Create a Home Valuation Report for This Property
The Home Valuation Report is an in-depth analysis detailing your home's value as well as a comparison with similar homes in the area
Home Values in the Area
Average Home Value in this Area
Purchase History
| Date | Buyer | Sale Price | Title Company |
|---|---|---|---|
| Christine A Carberry Ret | -- | None Available | |
| Christine A Carberry Ret | -- | None Available | |
| Timothy G Carberry Ret | -- | -- | |
| Timothy G Carberry Ret | -- | -- | |
| Carberry Timothy G | -- | -- | |
| Carberry Timothy G | -- | -- | |
| Carberry Timothy George | $145,000 | -- |
Source: Public Records
Tax History
| Year | Tax Paid | Tax Assessment Tax Assessment Total Assessment is a certain percentage of the fair market value that is determined by local assessors to be the total taxable value of land and additions on the property. | Land | Improvement |
|---|---|---|---|---|
| 2024 | $10,595 | $1,223,400 | $489,300 | $734,100 |
| 2023 | $9,824 | $1,223,400 | $489,300 | $734,100 |
| 2022 | $8,446 | $1,210,000 | $489,300 | $720,700 |
| 2021 | $7,954 | $778,300 | $332,900 | $445,400 |
| 2020 | $7,954 | $778,300 | $332,900 | $445,400 |
| 2019 | $7,936 | $776,500 | $332,900 | $443,600 |
| 2018 | $7,859 | $777,300 | $332,900 | $444,400 |
| 2017 | $7,859 | $777,300 | $332,900 | $444,400 |
| 2016 | $620 | $716,200 | $257,900 | $458,300 |
| 2015 | $7,807 | $716,200 | $257,900 | $458,300 |
| 2013 | $7,857 | $716,200 | $257,900 | $458,300 |
Source: Public Records
Map
Nearby Homes
- 1193 Ocean Blvd
- 1215 Ocean Blvd Unit 5
- 763 Ocean Blvd
- 137 Clark Rd
- 236 Sagamore Rd
- 389 Sagamore Rd
- 267 Pioneer Rd
- 14 Sagamore Rd Unit 3
- 4 Sagamore Rd
- 104 Odiorne Point Rd
- 239 Gosport Rd
- 46 Fowler Dr
- 1155 Sagamore Ave Unit 2
- 1155 Sagamore Ave Unit 3
- 1191 - 1193 Ocean Blvd
- 1591 Ocean Blvd
- 75 Marina Heights Rd
- 1643 Ocean Blvd
- 579 Sagamore Ave Unit 60
- 665 Wallis Rd Unit 2
- 243 Parsons Rd
- 238 Parsons Rd
- 230 Parsons Rd
- 246 Parsons Rd
- 224 Parsons Rd Unit 2
- 224 Parsons Rd
- 222 Parsons Rd
- 222 Parsons Rd Unit 2
- 222 Parsons Rd Unit 1
- 228 Parsons Rd
- 218 Parsons Rd
- 199 Parsons Rd
- 45 Marsh Rd
- 191 Parsons Rd
- 181 Parsons Rd
- 200 Parsons Rd
- 24 Port Way
- 180 Parsons Rd
- 136 Brackett Rd
Your Personal Tour Guide
Ask me questions while you tour the home.