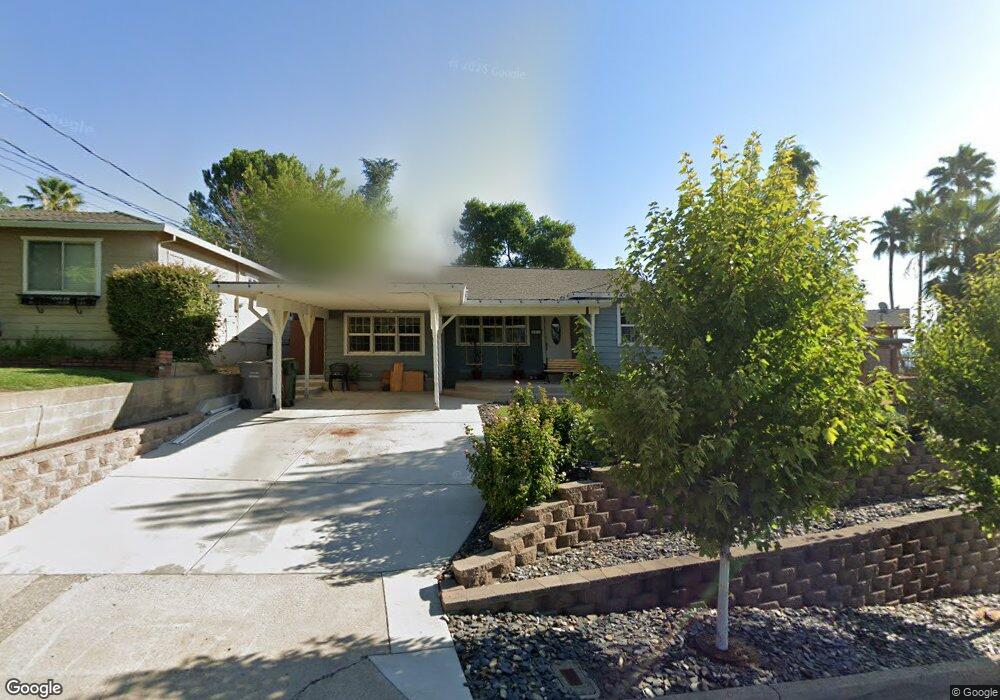
2351 Skyline Dr Redding, CA 96001
Greenwood NeighborhoodEstimated Value: $312,000 - $333,618
2
Beds
2
Baths
1,487
Sq Ft
$216/Sq Ft
Est. Value
About This Home
This home is located at 2351 Skyline Dr, Redding, CA 96001 and is currently estimated at $321,905, approximately $216 per square foot. 2351 Skyline Dr is a home located in Shasta County with nearby schools including Cypress Elementary School, Sequoia Middle School, and Shasta High School.
Ownership History
Date
Name
Owned For
Owner Type
Purchase Details
Closed on
May 19, 2021
Sold by
Hester Jeremy S
Bought by
Hester Jeremy S and Hester Stephanie
Current Estimated Value
Home Financials for this Owner
Home Financials are based on the most recent Mortgage that was taken out on this home.
Original Mortgage
$175,000
Outstanding Balance
$132,490
Interest Rate
3.1%
Mortgage Type
New Conventional
Estimated Equity
$189,415
Purchase Details
Closed on
May 25, 2017
Sold by
Hester Jeremy and Hester Elizabeth
Bought by
Hester Jeremy S
Home Financials for this Owner
Home Financials are based on the most recent Mortgage that was taken out on this home.
Original Mortgage
$161,000
Interest Rate
3.97%
Mortgage Type
New Conventional
Purchase Details
Closed on
May 6, 2010
Sold by
Nightingayle Aurore I
Bought by
Hester Jeremy and Hester Elizabeth
Home Financials for this Owner
Home Financials are based on the most recent Mortgage that was taken out on this home.
Original Mortgage
$142,373
Interest Rate
4.87%
Mortgage Type
FHA
Create a Home Valuation Report for This Property
The Home Valuation Report is an in-depth analysis detailing your home's value as well as a comparison with similar homes in the area
Home Values in the Area
Average Home Value in this Area
Purchase History
| Date | Buyer | Sale Price | Title Company |
|---|---|---|---|
| Hester Jeremy S | -- | Fidelity National Title Co | |
| Hester Jeremy S | -- | First American Title Company | |
| Hester Jeremy | $145,000 | Fidelity Natl Title Co Of Ca |
Source: Public Records
Mortgage History
| Date | Status | Borrower | Loan Amount |
|---|---|---|---|
| Open | Hester Jeremy S | $175,000 | |
| Closed | Hester Jeremy S | $161,000 | |
| Closed | Hester Jeremy | $142,373 |
Source: Public Records
Tax History
| Year | Tax Paid | Tax Assessment Tax Assessment Total Assessment is a certain percentage of the fair market value that is determined by local assessors to be the total taxable value of land and additions on the property. | Land | Improvement |
|---|---|---|---|---|
| 2025 | $1,888 | $180,700 | $51,627 | $129,073 |
| 2024 | $1,859 | $177,158 | $50,615 | $126,543 |
| 2023 | $1,859 | $173,685 | $49,623 | $124,062 |
| 2022 | $1,828 | $170,280 | $48,650 | $121,630 |
| 2021 | $1,819 | $166,943 | $47,697 | $119,246 |
| 2020 | $1,843 | $165,232 | $47,208 | $118,024 |
| 2019 | $1,750 | $161,993 | $46,283 | $115,710 |
| 2018 | $1,765 | $158,818 | $45,376 | $113,442 |
| 2017 | $1,756 | $155,705 | $44,487 | $111,218 |
| 2016 | $1,700 | $152,653 | $43,615 | $109,038 |
| 2015 | $1,678 | $150,361 | $42,960 | $107,401 |
| 2014 | $1,667 | $147,417 | $42,119 | $105,298 |
Source: Public Records
Map
Nearby Homes
- 2077 Skyline Dr
- 1777 Magnolia Ave
- 1868 Gold St
- 3024 West St
- 2381/2401 West St
- 2330 West St
- 2514 California St
- 2123 Waldon St
- 2405 Cliff Dr
- 1545 Olive Ave
- 1569 Walnut Ave
- 1575 Fig Ave
- 0 California St Unit 25-5331
- 3443 West St
- 3496 Summit Dr
- 1012 State St
- 3244 Veda St
- 864 Kite Ln
- 745 Parkview Ave
- 2565 North St
- 2341 Skyline Dr Unit 1
- 2341 Skyline Dr
- 2365 Skyline Dr Unit 1
- 2331 Skyline Dr
- 2220 Octavia St
- 2240 Alameda Ave
- 2250 Alameda Ave
- 2259 Sonoma St
- 2352 Skyline Dr
- 2362 Skyline Dr
- 2342 Skyline Dr
- 2266 Alameda Ave Unit 1
- 2266 Alameda Ave
- 2332 Skyline Dr
- 2322 Skyline Dr
- 2210 Alameda Ave
- 2312 Skyline Dr
- 2323 Monterey Ct
- 2242 Sonoma St
- 2259 Alameda Ave
Your Personal Tour Guide
Ask me questions while you tour the home.