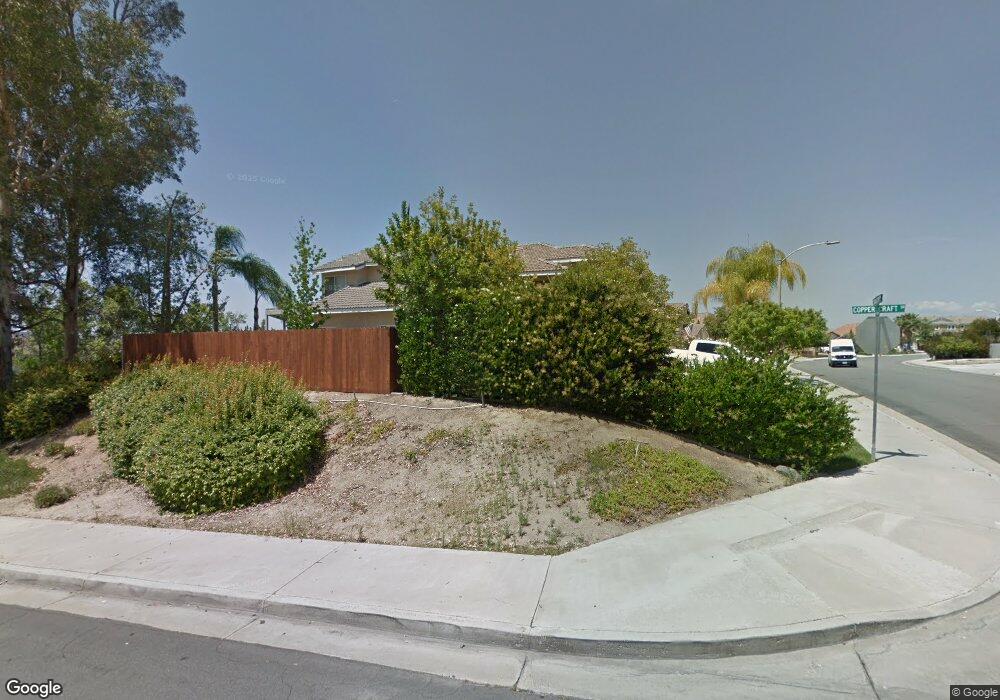
23515 Cornucopia Way Murrieta, CA 92562
Greer Ranch NeighborhoodEstimated Value: $722,356 - $749,000
4
Beds
3
Baths
2,162
Sq Ft
$338/Sq Ft
Est. Value
About This Home
This home is located at 23515 Cornucopia Way, Murrieta, CA 92562 and is currently estimated at $731,589, approximately $338 per square foot. 23515 Cornucopia Way is a home located in Riverside County with nearby schools including Antelope Hills Elementary School, Shivela Middle School, and Murrieta Mesa High School.
Ownership History
Date
Name
Owned For
Owner Type
Purchase Details
Closed on
Jun 9, 1999
Sold by
Ketelboeter Pamela Lyn
Bought by
Ketelboeter Randy Gene
Current Estimated Value
Home Financials for this Owner
Home Financials are based on the most recent Mortgage that was taken out on this home.
Original Mortgage
$157,500
Outstanding Balance
$41,025
Interest Rate
6.9%
Estimated Equity
$690,564
Purchase Details
Closed on
Jun 2, 1999
Sold by
Federal Home Loan Mortgage Corporation
Bought by
Ketelboeter Randy Gene
Home Financials for this Owner
Home Financials are based on the most recent Mortgage that was taken out on this home.
Original Mortgage
$157,500
Outstanding Balance
$41,025
Interest Rate
6.9%
Estimated Equity
$690,564
Purchase Details
Closed on
Oct 28, 1998
Sold by
Hyllested John D and Hyllested Peggy A
Bought by
Federal Home Loans Mtg Corp
Create a Home Valuation Report for This Property
The Home Valuation Report is an in-depth analysis detailing your home's value as well as a comparison with similar homes in the area
Home Values in the Area
Average Home Value in this Area
Purchase History
| Date | Buyer | Sale Price | Title Company |
|---|---|---|---|
| Ketelboeter Randy Gene | -- | First American Title Co | |
| Ketelboeter Randy Gene | $175,000 | First American Title Co | |
| Federal Home Loans Mtg Corp | $154,659 | -- |
Source: Public Records
Mortgage History
| Date | Status | Borrower | Loan Amount |
|---|---|---|---|
| Open | Ketelboeter Randy Gene | $157,500 |
Source: Public Records
Tax History Compared to Growth
Tax History
| Year | Tax Paid | Tax Assessment Tax Assessment Total Assessment is a certain percentage of the fair market value that is determined by local assessors to be the total taxable value of land and additions on the property. | Land | Improvement |
|---|---|---|---|---|
| 2025 | $3,305 | $293,908 | $94,048 | $199,860 |
| 2023 | $3,305 | $282,497 | $90,397 | $192,100 |
| 2022 | $3,291 | $276,959 | $88,625 | $188,334 |
| 2021 | $3,229 | $271,530 | $86,888 | $184,642 |
| 2020 | $3,197 | $268,747 | $85,998 | $182,749 |
| 2019 | $3,138 | $263,478 | $84,312 | $179,166 |
| 2018 | $3,079 | $258,312 | $82,659 | $175,653 |
| 2017 | $3,037 | $253,248 | $81,039 | $172,209 |
| 2016 | $2,997 | $248,283 | $79,450 | $168,833 |
| 2015 | $2,966 | $244,555 | $78,257 | $166,298 |
| 2014 | $2,832 | $239,767 | $76,725 | $163,042 |
Source: Public Records
Map
Nearby Homes
- 39785 Spinning Wheel Dr
- 23573 Spindle Way
- 39944 Spicewood Ave
- 35965 Darcy Place
- 39560 Tinderbox Way
- 35944 Wilcox Ln
- 23664 Groveland Place
- 23634 Underwood Cir
- 36029 Mustang Spirit Ln
- 39766 Pinedale Way
- 36060 Lipizzan Ln
- 36050 Redgrave Way
- 23638 Sonata Dr
- 25199 Loring Rd
- 35610 Jewel Ln
- 36034 Redgrave Way
- 23753 Five Tribes Trail
- 23825 Five Tribes Trail
- 25180 Elliott Rd Unit 1
- 39647 Dartanian Place
- 23511 Cornucopia Way
- 23507 Cornucopia Way
- 23514 Cornucopia Way
- 39700 Copper Craft Dr
- 39710 Copper Craft Dr
- 23508 Cornucopia Way
- 39690 Copper Craft Dr
- 23503 Cornucopia Way
- 23558 Wooden Horse Trail
- 23552 Wooden Horse Trail
- 23548 Wooden Horse Trail
- 39670 Copper Craft Dr
- 23562 Wooden Horse Trail
- 23542 Wooden Horse Trail
- 39665 Copper Craft Dr
- 23568 Wooden Horse Trail
- 39650 Copper Craft Dr
- 25571 Via Sarah
- 25583 Via Sarah
- 23538 Wooden Horse Trail