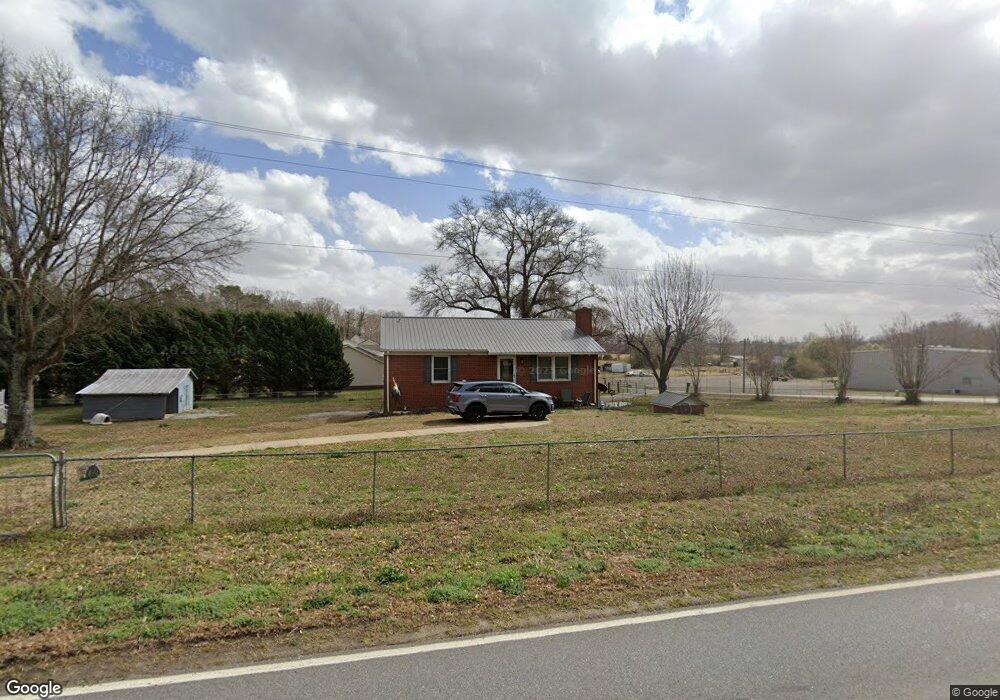
2353 S Post Rd Shelby, NC 28152
Estimated Value: $138,367 - $172,000
--
Bed
--
Bath
1,200
Sq Ft
$129/Sq Ft
Est. Value
About This Home
This home is located at 2353 S Post Rd, Shelby, NC 28152 and is currently estimated at $154,592, approximately $128 per square foot. 2353 S Post Rd is a home located in Cleveland County with nearby schools including Township Three Elementary School, Crest Middle School, and Crest High School.
Ownership History
Date
Name
Owned For
Owner Type
Purchase Details
Closed on
Jun 29, 2021
Sold by
Stroup Jason W and Stroup Melissa D
Bought by
Manley Penny D
Current Estimated Value
Home Financials for this Owner
Home Financials are based on the most recent Mortgage that was taken out on this home.
Original Mortgage
$141,414
Outstanding Balance
$128,311
Interest Rate
2.9%
Mortgage Type
New Conventional
Estimated Equity
$26,281
Purchase Details
Closed on
Mar 3, 2015
Sold by
Blue Star Ventures Llc
Bought by
Stroup Jason W
Home Financials for this Owner
Home Financials are based on the most recent Mortgage that was taken out on this home.
Original Mortgage
$69,562
Interest Rate
3.75%
Mortgage Type
New Conventional
Purchase Details
Closed on
Sep 26, 2012
Sold by
White Mary H and White Dan R
Bought by
The Bank Of New York Mellon and The Bank Of New York
Purchase Details
Closed on
Jan 14, 2012
Sold by
The Bank Of New York Mellon
Bought by
Blue Star Ventures Llc
Create a Home Valuation Report for This Property
The Home Valuation Report is an in-depth analysis detailing your home's value as well as a comparison with similar homes in the area
Home Values in the Area
Average Home Value in this Area
Purchase History
| Date | Buyer | Sale Price | Title Company |
|---|---|---|---|
| Manley Penny D | $140,000 | None Available | |
| Stroup Jason W | $68,500 | None Available | |
| The Bank Of New York Mellon | $49,500 | None Available | |
| Blue Star Ventures Llc | $38,000 | None Available |
Source: Public Records
Mortgage History
| Date | Status | Borrower | Loan Amount |
|---|---|---|---|
| Open | Manley Penny D | $141,414 | |
| Previous Owner | Stroup Jason W | $69,562 |
Source: Public Records
Tax History Compared to Growth
Tax History
| Year | Tax Paid | Tax Assessment Tax Assessment Total Assessment is a certain percentage of the fair market value that is determined by local assessors to be the total taxable value of land and additions on the property. | Land | Improvement |
|---|---|---|---|---|
| 2025 | $1,077 | $169,615 | $35,340 | $134,275 |
| 2024 | $691 | $76,838 | $20,150 | $56,688 |
| 2023 | $688 | $76,838 | $20,150 | $56,688 |
| 2022 | $688 | $76,838 | $20,150 | $56,688 |
| 2021 | $636 | $76,838 | $20,150 | $56,688 |
| 2020 | $612 | $71,282 | $20,150 | $51,132 |
| 2019 | $612 | $71,282 | $20,150 | $51,132 |
| 2018 | $611 | $71,282 | $20,150 | $51,132 |
| 2017 | $608 | $71,282 | $20,150 | $51,132 |
| 2016 | $582 | $71,282 | $20,150 | $51,132 |
| 2015 | $642 | $78,871 | $18,200 | $60,671 |
| 2014 | $642 | $78,871 | $18,200 | $60,671 |
Source: Public Records
Map
Nearby Homes
- 451 Davis Rd Unit 7
- 451 Davis Rd Unit 4
- 106 Seven Hawks Trail Unit 3
- 1803 Sulphur Springs Rd
- 2237 Ellis Rd
- 5115 Circle Dr
- 4209 Homeplace Dr
- 5409 Canterbury Rd
- 2145 Ellis Rd
- 106 Holden Dr
- 1701 Cedar Creek Rd
- 2923 G B Blanton Rd
- 1100 Blacksburg Rd
- 2715 S Post Rd
- 5009 Pecan Dr
- 323 Christopher Rd
- 5061 Pecan Dr
- 217 Ridgewood St
- 2036 Biggers Lake Rd
- 0 Winter Park Dr
- 503 Davis Rd
- 2350 S Post Rd
- 2348 S Post Rd
- 2352 S Post Rd
- 505 Davis Rd
- 2346 S Post Rd
- 102 Eagles Nest Way
- 106 Eagles Nest Way
- 507 Davis Rd
- 112 Eagles Nest Way
- 11 Clifton Dr
- 2344 S Post Rd
- 116 Eagles Nest Way
- 509 Davis Rd
- 2342 S Post Rd
- 10 Turner Rd
- 8 Clifton Dr
- 2 Turner Rd
- 508 Davis Rd
- 2340 S Post Rd