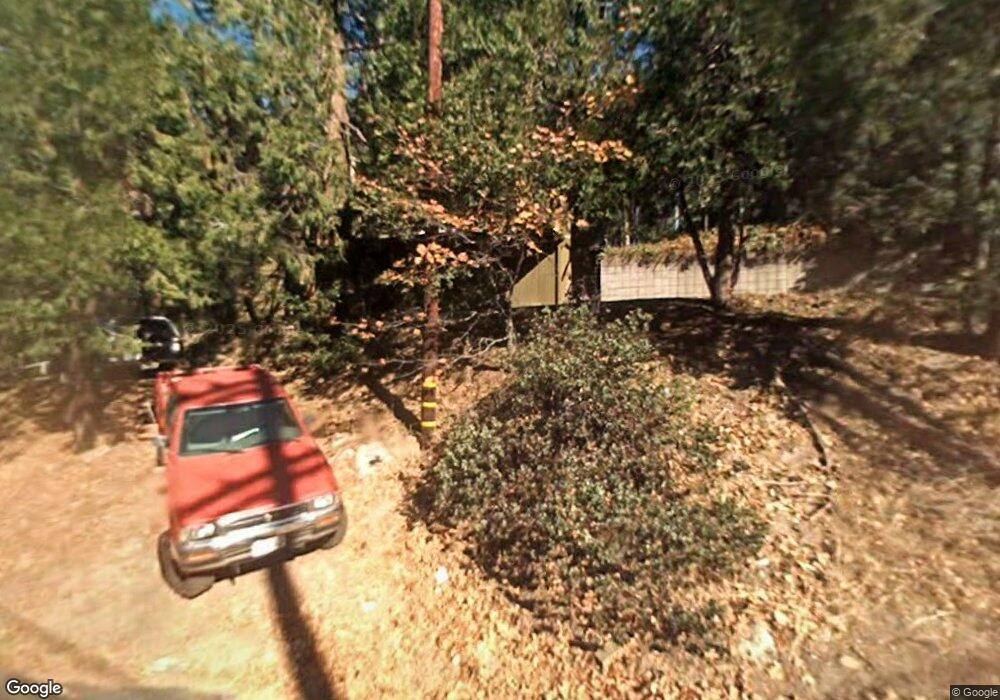
23546 Knapps Cutoff Crestline, CA 92325
Estimated Value: $260,876 - $321,000
3
Beds
2
Baths
1,428
Sq Ft
$200/Sq Ft
Est. Value
About This Home
This home is located at 23546 Knapps Cutoff, Crestline, CA 92325 and is currently estimated at $285,969, approximately $200 per square foot. 23546 Knapps Cutoff is a home located in San Bernardino County with nearby schools including Valley Of Enchantment Elementary School, Mary P. Henck Intermediate School, and Rim Of The World Senior High School.
Ownership History
Date
Name
Owned For
Owner Type
Purchase Details
Closed on
Apr 7, 2010
Sold by
Homesales Inc
Bought by
Marrs Johnnie M and Marrs Kathleen R
Current Estimated Value
Purchase Details
Closed on
Jan 11, 2010
Sold by
Nazarzai Zahid A
Bought by
Homesales Inc
Purchase Details
Closed on
Oct 26, 2006
Sold by
Wells Fargo Bank Na
Bought by
Nazarzai Zahid Ahmad
Purchase Details
Closed on
Aug 11, 2006
Sold by
Saffell Brian P and Saffell Mary A
Bought by
Wells Fargo Bank Na
Purchase Details
Closed on
May 15, 2002
Sold by
Osullivan Emmett J and Osullivan Marjorie A
Bought by
Saffell Brian P and Saffell Mary A
Home Financials for this Owner
Home Financials are based on the most recent Mortgage that was taken out on this home.
Original Mortgage
$84,000
Interest Rate
8.25%
Create a Home Valuation Report for This Property
The Home Valuation Report is an in-depth analysis detailing your home's value as well as a comparison with similar homes in the area
Home Values in the Area
Average Home Value in this Area
Purchase History
| Date | Buyer | Sale Price | Title Company |
|---|---|---|---|
| Marrs Johnnie M | $75,000 | Multiple | |
| Homesales Inc | $105,952 | Servicelink | |
| Nazarzai Zahid Ahmad | $165,000 | First American Title Ins Co | |
| Wells Fargo Bank Na | $160,790 | First American | |
| Saffell Brian P | $105,000 | First American Title |
Source: Public Records
Mortgage History
| Date | Status | Borrower | Loan Amount |
|---|---|---|---|
| Previous Owner | Saffell Brian P | $84,000 |
Source: Public Records
Tax History Compared to Growth
Tax History
| Year | Tax Paid | Tax Assessment Tax Assessment Total Assessment is a certain percentage of the fair market value that is determined by local assessors to be the total taxable value of land and additions on the property. | Land | Improvement |
|---|---|---|---|---|
| 2025 | $553 | $25,816 | $25,816 | -- |
| 2024 | $553 | $25,310 | $25,310 | -- |
| 2023 | $1,332 | $24,816 | $24,816 | $68,238 |
| 2022 | $1,304 | $91,229 | $24,329 | $66,900 |
| 2021 | $1,286 | $89,440 | $23,852 | $65,588 |
| 2020 | $1,281 | $88,522 | $23,607 | $64,915 |
| 2019 | $1,269 | $86,786 | $23,144 | $63,642 |
| 2018 | $1,076 | $85,084 | $22,690 | $62,394 |
| 2017 | $1,057 | $83,416 | $22,245 | $61,171 |
| 2016 | $1,027 | $81,781 | $21,809 | $59,972 |
| 2015 | $1,016 | $80,552 | $21,481 | $59,071 |
| 2014 | $999 | $78,974 | $21,060 | $57,914 |
Source: Public Records
Map
Nearby Homes
- 23581 Lake Dr
- 634 Rose Hill Dr
- 23550 Lake Dr
- 23683 Manzanita Dr
- 23594 Hillside Dr
- 23511 Lake Dr
- 23730 Shady Ln
- 23696 Manzanita Dr
- 23718 Scenic Dr
- 23497 Lake Dr
- 23717 Scenic Dr
- 668 Mormon Springs Rd
- 23489 Lake Dr
- 693 California 138
- 532 Sunset Ln
- 0 S Edelweiss Dr Unit 219132032DA
- 0 S Edelweiss Dr Unit 32501759
- 1000 Pines Rd
- 0 Scenic View Unit IG25232123
- 0 S Edelweiss Dr Unit IG25154023
- 23546 Knapps Cutoff
- 23546 Knapps Cut
- 23540 Knapps Cutoff
- 23540 Knapps Cut
- 23540 Knapps Cutoff
- 618 Ridge Place
- 23570 Knapps Cutoff
- 23545 Knapps Cutoff
- 23541 Knapps Cutoff
- 23532 Knapps Cutoff
- 23535 Knapps Cutoff
- 23529 Knapps Cutoff
- 23570 Knapps Cutoff
- 23526 Knapps Cutoff
- 607 Ridge Place
- 7970 On Knapps Cut Off and Lake
- 23525 Knapps Cutoff
- 23555 Knapps Cutoff
- 23555 Knapps Cutoff
- 670 Cedar Ln