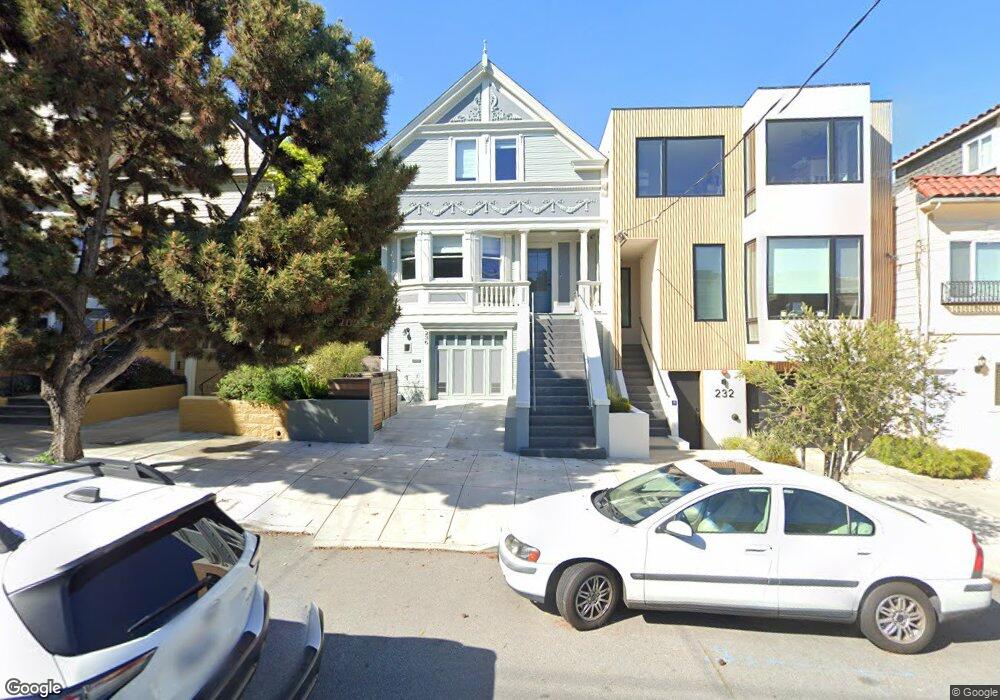
236 Clipper St San Francisco, CA 94114
Noe Valley NeighborhoodEstimated Value: $3,073,000 - $5,092,000
3
Beds
4
Baths
2,131
Sq Ft
$1,983/Sq Ft
Est. Value
About This Home
This home is located at 236 Clipper St, San Francisco, CA 94114 and is currently estimated at $4,226,034, approximately $1,983 per square foot. 236 Clipper St is a home located in San Francisco County with nearby schools including Alvarado Elementary, James Lick Middle School, and St. Philip School.
Ownership History
Date
Name
Owned For
Owner Type
Purchase Details
Closed on
May 15, 2019
Sold by
Johanna And Brian Roberts Family Trust
Bought by
The Paul Hammond Living Trust
Current Estimated Value
Home Financials for this Owner
Home Financials are based on the most recent Mortgage that was taken out on this home.
Original Mortgage
$1,950,000
Interest Rate
4.2%
Mortgage Type
Credit Line Revolving
Purchase Details
Closed on
Jul 13, 2007
Sold by
Roberts Brian J and Roberts Johanna W
Bought by
Roberts Brian J and Roberts Johanna W
Purchase Details
Closed on
Aug 5, 2002
Sold by
Ross Mary C
Bought by
Roberts Brian J and Roberts Johanna W
Home Financials for this Owner
Home Financials are based on the most recent Mortgage that was taken out on this home.
Original Mortgage
$825,000
Interest Rate
5.37%
Purchase Details
Closed on
May 21, 2001
Sold by
Buckley Jacqueline Ann
Bought by
Ross Mary C
Home Financials for this Owner
Home Financials are based on the most recent Mortgage that was taken out on this home.
Original Mortgage
$625,000
Interest Rate
7.14%
Mortgage Type
Stand Alone First
Purchase Details
Closed on
Jun 23, 1998
Sold by
Buckley Arthur D
Bought by
Buckley Jacqueline Ann
Create a Home Valuation Report for This Property
The Home Valuation Report is an in-depth analysis detailing your home's value as well as a comparison with similar homes in the area
Home Values in the Area
Average Home Value in this Area
Purchase History
| Date | Buyer | Sale Price | Title Company |
|---|---|---|---|
| The Paul Hammond Living Trust | $3,000,000 | First Amer Ttl Co Redwood Ci | |
| Roberts Brian J | -- | None Available | |
| Roberts Brian J | -- | None Available | |
| Roberts Brian J | $1,100,000 | Old Republic Title Company | |
| Ross Mary C | $630,000 | Old Republic Title Company | |
| Buckley Jacqueline Ann | -- | -- |
Source: Public Records
Mortgage History
| Date | Status | Borrower | Loan Amount |
|---|---|---|---|
| Closed | The Paul Hammond Living Trust | $1,950,000 | |
| Previous Owner | Roberts Brian J | $825,000 | |
| Previous Owner | Ross Mary C | $625,000 |
Source: Public Records
Tax History Compared to Growth
Tax History
| Year | Tax Paid | Tax Assessment Tax Assessment Total Assessment is a certain percentage of the fair market value that is determined by local assessors to be the total taxable value of land and additions on the property. | Land | Improvement |
|---|---|---|---|---|
| 2025 | $55,556 | $4,775,818 | $2,342,588 | $2,433,230 |
| 2024 | $55,556 | $4,682,176 | $2,296,655 | $2,385,521 |
| 2023 | $54,744 | $4,590,370 | $2,251,623 | $2,338,747 |
| 2022 | $42,246 | $3,525,854 | $2,207,474 | $1,318,380 |
| 2021 | $40,926 | $3,407,701 | $2,164,191 | $1,243,510 |
| 2020 | $37,413 | $3,060,000 | $2,142,000 | $918,000 |
| 2019 | $19,328 | $1,583,755 | $856,908 | $726,847 |
| 2018 | $18,675 | $1,552,702 | $840,106 | $712,596 |
| 2017 | $18,155 | $1,522,259 | $823,634 | $698,625 |
| 2016 | $17,868 | $1,492,412 | $807,485 | $684,927 |
| 2015 | $17,647 | $1,469,995 | $795,356 | $674,639 |
| 2014 | $17,180 | $1,441,202 | $779,777 | $661,425 |
Source: Public Records
Map
Nearby Homes
- 4044 26th St
- 3936 26th St
- 4047 Cesar Chavez St
- 1300 Church St
- 222 Jersey St
- 258-260 Jersey St
- 228 Vicksburg St Unit 2
- 228 Vicksburg St Unit 3
- 1801 Castro St
- 1463 Noe St
- 1485 Noe St
- 1161 Church St
- 3879 23rd St
- 4258 26th St
- 245 Duncan St
- 3821 23rd St
- 1541 Sanchez St
- 269A Chattanooga St
- 479 28th St
- 524 28th St
- 232 Clipper St
- 240 Clipper St
- 246 Clipper St
- 228 Clipper St
- 222 Clipper St Unit 224
- 252 Clipper St Unit 254
- 256 Clipper St
- 218 Clipper St
- 4037 25th St
- 4043 25th St
- 4029 25th St Unit 4031
- 4047 25th St
- 260 Clipper St
- 208 Clipper St
- 206 Clipper St
- 4049 25th St Unit 1
- 4051 25th St Unit 2
- 4051 25th St Unit 1
- 4023 25th St
- 4055 25th St