236 Monroe Irvine, CA 92620
Northwood NeighborhoodEstimated Value: $944,582 - $1,018,000
3
Beds
3
Baths
1,288
Sq Ft
$753/Sq Ft
Est. Value
About This Home
This home is located at 236 Monroe, Irvine, CA 92620 and is currently estimated at $970,146, approximately $753 per square foot. 236 Monroe is a home located in Orange County with nearby schools including Brywood Elementary School, Sierra Vista Middle School, and Northwood High School.
Ownership History
Date
Name
Owned For
Owner Type
Purchase Details
Closed on
Jan 21, 2004
Sold by
Kim Kathy
Bought by
Zhang Zhong and Hwang Showlian
Current Estimated Value
Home Financials for this Owner
Home Financials are based on the most recent Mortgage that was taken out on this home.
Original Mortgage
$333,700
Outstanding Balance
$133,865
Interest Rate
3.87%
Mortgage Type
Purchase Money Mortgage
Estimated Equity
$836,281
Purchase Details
Closed on
Jan 17, 2003
Sold by
Kim Gab Su
Bought by
Kim Kathy
Purchase Details
Closed on
Nov 13, 2002
Sold by
Lee Seung Su and Lee Young Shin
Bought by
Kim Kathy
Purchase Details
Closed on
May 31, 2001
Sold by
Lee David Seung and Lee Janice Young
Bought by
Lee Seung Su and Lee Young Shin
Purchase Details
Closed on
Jun 20, 2000
Sold by
Metzger Deborah L
Bought by
Lee Seung Su and Lee Young Shin
Home Financials for this Owner
Home Financials are based on the most recent Mortgage that was taken out on this home.
Original Mortgage
$190,300
Interest Rate
8.12%
Create a Home Valuation Report for This Property
The Home Valuation Report is an in-depth analysis detailing your home's value as well as a comparison with similar homes in the area
Home Values in the Area
Average Home Value in this Area
Purchase History
We collect this data history from publicly available records. To have your information removed, we recommend requesting removal directly through your county’s website.
| Date | Buyer | Sale Price | Title Company |
|---|---|---|---|
| Zhang Zhong | $440,000 | Fidelity National Title | |
| Kim Kathy | -- | -- | |
| Kim Kathy | $339,000 | Ticor Title Orange | |
| Lee Seung Su | -- | -- | |
| Lee Seung Su | $238,000 | United Title Company |
Source: Public Records
Mortgage History
We collect this data history from publicly available records. To have your information removed, we recommend requesting removal directly through your county’s website.
| Date | Status | Borrower | Loan Amount |
|---|---|---|---|
| Open | Zhang Zhong | $333,700 | |
| Previous Owner | Lee Seung Su | $190,300 | |
| Closed | Zhang Zhong | $84,300 |
Source: Public Records
Tax History
| Year | Tax Paid | Tax Assessment Tax Assessment Total Assessment is a certain percentage of the fair market value that is determined by local assessors to be the total taxable value of land and additions on the property. | Land | Improvement |
|---|---|---|---|---|
| 2025 | $6,666 | $625,582 | $486,792 | $138,790 |
| 2024 | $6,666 | $613,316 | $477,247 | $136,069 |
| 2023 | $6,495 | $601,291 | $467,890 | $133,401 |
| 2022 | $6,370 | $589,501 | $458,715 | $130,786 |
| 2021 | $6,224 | $577,943 | $449,721 | $128,222 |
| 2020 | $6,189 | $572,017 | $445,109 | $126,908 |
| 2019 | $6,053 | $560,801 | $436,381 | $124,420 |
| 2018 | $5,946 | $549,805 | $427,824 | $121,981 |
| 2017 | $5,824 | $539,025 | $419,435 | $119,590 |
| 2016 | $5,569 | $528,456 | $411,210 | $117,246 |
| 2015 | $5,286 | $506,000 | $400,330 | $105,670 |
| 2014 | $4,997 | $478,000 | $372,330 | $105,670 |
Source: Public Records
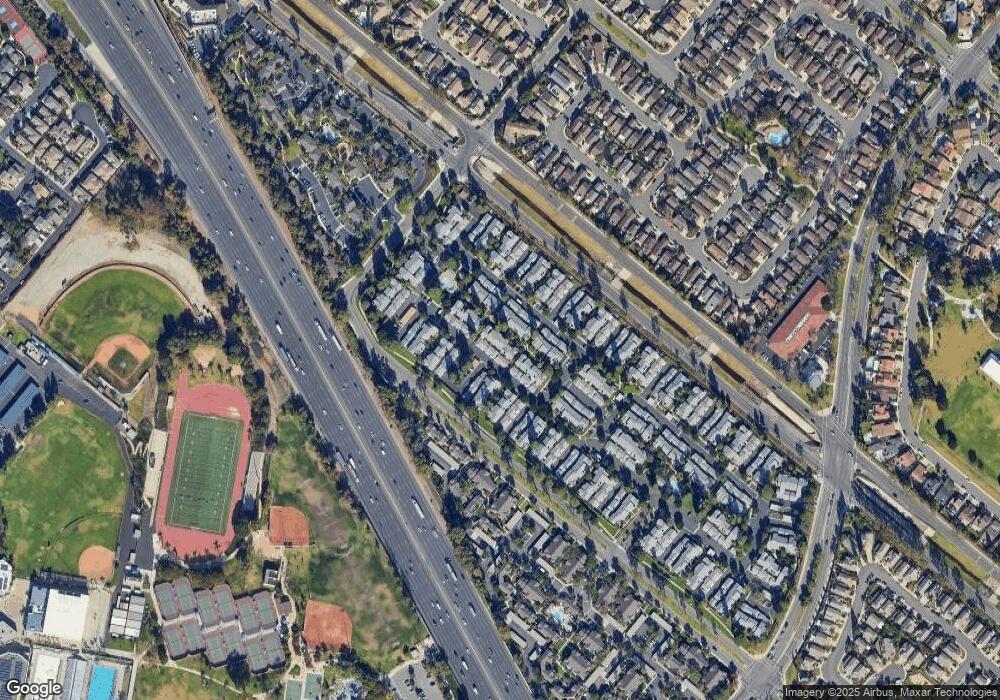
Map
Nearby Homes
- 178 Monroe
- 198 Monroe Unit 147
- 13802 Margene Cir
- 2 Shelby
- 4062 Escudero Dr
- 26 Appomattox
- 25 Cheyenne Unit 68
- 35 Lindberg
- 14232 Matisse Ave
- 40 Trailing Vine Unit 26
- 7 Boone
- 4512 Robinwood Cir
- 83 Huntington Unit 278
- 26 Helena Unit 69
- 82 Trailing Vine
- 14272 Saarinen Ct
- 14072 Picasso Ct
- 32 Remington
- 4171 Blackfin Ave
- 76 Trailing Vine
- 114 Monroe Unit 144
- 118 Monroe Unit 146
- 104 Monroe Unit 139
- 116 Monroe
- 112 Monroe Unit 143
- 114 Monroe
- 106 Monroe Unit 140
- 122 Monroe
- 124 Monroe Unit 227
- 126 Monroe Unit 228
- 126 Monroe
- 128 Monroe
- 102 Monroe Unit 138
- 102 Monroe
- 100 Monroe Unit 137
- 96 Monroe Unit 131
- 96 Monroe
- 94 Monroe Unit 132
- 92 Monroe Unit 133
- 132 Monroe Unit 234
Your Personal Tour Guide
Ask me questions while you tour the home.