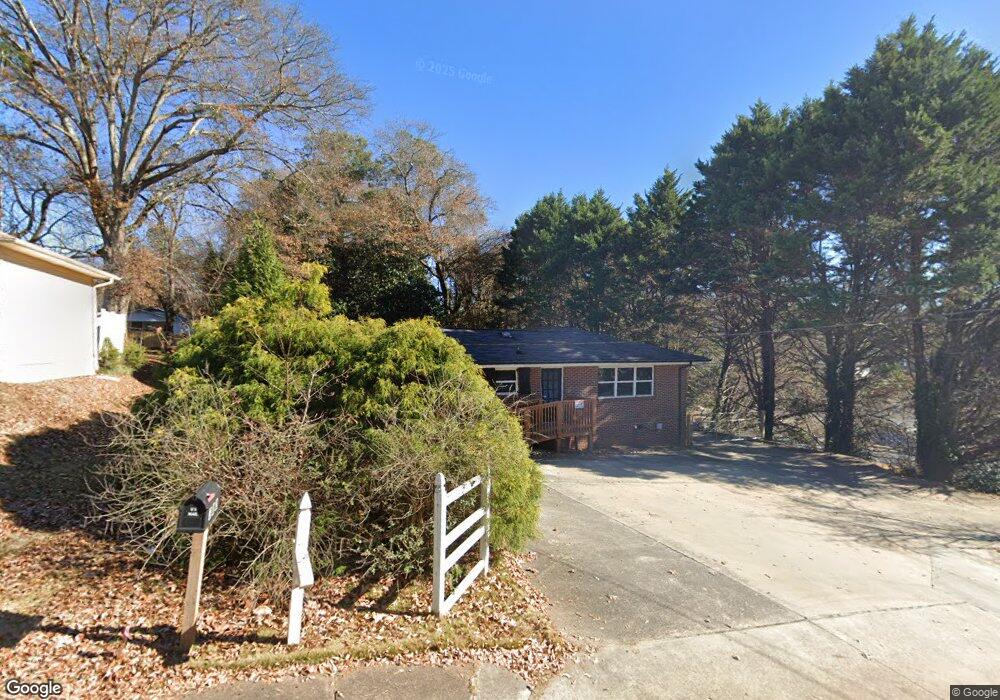
236 West Ave Gainesville, GA 30501
Central Core NeighborhoodEstimated Value: $313,067
Studio
--
Bath
1,505
Sq Ft
$208/Sq Ft
Est. Value
About This Home
This home is located at 236 West Ave, Gainesville, GA 30501 and is currently estimated at $313,067, approximately $208 per square foot. 236 West Ave is a home located in Hall County with nearby schools including Centennial Arts Academy, Gainesville Middle School, and Gainesville High School.
Ownership History
Date
Name
Owned For
Owner Type
Purchase Details
Closed on
Jul 24, 2023
Sold by
Crawford Donna C
Bought by
Sawyer Ryan
Current Estimated Value
Purchase Details
Closed on
Jul 21, 2023
Sold by
United Community Bank
Bought by
Crawford Adren and Crawford Donna C
Purchase Details
Closed on
Jan 8, 2018
Sold by
Ritenour John
Bought by
Dinov Ralph
Purchase Details
Closed on
Jun 21, 2007
Sold by
Crouse Jacqueline D
Bought by
Crawford Adren
Home Financials for this Owner
Home Financials are based on the most recent Mortgage that was taken out on this home.
Original Mortgage
$185,803
Interest Rate
6.1%
Mortgage Type
Commercial
Purchase Details
Closed on
Apr 1, 2005
Sold by
Brooks Kate W
Bought by
Allison Builders Llc
Home Financials for this Owner
Home Financials are based on the most recent Mortgage that was taken out on this home.
Original Mortgage
$88,000
Interest Rate
5.62%
Mortgage Type
Commercial
Purchase Details
Closed on
Oct 28, 1999
Sold by
Brooks Harold B
Bought by
Brooks Kate W
Create a Home Valuation Report for This Property
The Home Valuation Report is an in-depth analysis detailing your home's value as well as a comparison with similar homes in the area
Home Values in the Area
Average Home Value in this Area
Purchase History
| Date | Buyer | Sale Price | Title Company |
|---|---|---|---|
| Sawyer Ryan | $299,000 | -- | |
| Crawford Adren | $299,000 | -- | |
| Dinov Ralph | $2,650,000 | -- | |
| Crawford Adren | $225,000 | -- | |
| Allison Builders Llc | $99,500 | -- | |
| Brooks Kate W | -- | -- |
Source: Public Records
Mortgage History
| Date | Status | Borrower | Loan Amount |
|---|---|---|---|
| Previous Owner | Crawford Adren | $185,803 | |
| Previous Owner | Allison Builders Llc | $88,000 |
Source: Public Records
Tax History
| Year | Tax Paid | Tax Assessment Tax Assessment Total Assessment is a certain percentage of the fair market value that is determined by local assessors to be the total taxable value of land and additions on the property. | Land | Improvement |
|---|---|---|---|---|
| 2025 | $3,659 | $128,688 | $46,360 | $82,328 |
| 2024 | $3,225 | $112,608 | $46,360 | $66,248 |
| 2023 | $2,478 | $84,448 | $34,760 | $49,688 |
| 2022 | $306 | $64,928 | $32,440 | $32,488 |
| 2021 | $305 | $58,568 | $26,080 | $32,488 |
| 2020 | $1,761 | $58,568 | $26,080 | $32,488 |
| 2019 | $1,654 | $54,208 | $21,720 | $32,488 |
| 2018 | $322 | $54,208 | $21,720 | $32,488 |
| 2017 | $363 | $54,208 | $21,720 | $32,488 |
| 2016 | $1,642 | $54,208 | $21,720 | $32,488 |
| 2015 | $1,526 | $54,208 | $21,720 | $32,488 |
| 2014 | $1,526 | $79,258 | $40,560 | $38,698 |
Source: Public Records
Map
Nearby Homes
- 705 Oak St
- 515 Nightfire Ct SW
- 510 Nightfire Ct SW
- 354 Clarendon Ct SE
- 358 Clarendon Ct SE
- 652 Wilshire Place
- 235 Tower Heights Rd
- 601 Ridgewood Ave
- 405 Forrest Ln
- 430 Forrest Ave
- 425 North Ave Unit B
- 804 Wilshire Rd
- 810 Hillside Dr
- 380 Forrest Ave
- 372 Forrest Ave
- 368 Forrest Ave
- 724 Bradford St NW
- 593 Shallowford Rd NW
- 440 Ridgewood Ave
- 1255 Purina Dr
- 300 West Ave
- 800 James St
- 241 West Ave
- 732 James St
- 906 NW Washington Corner NW
- 314 West Ave
- 329 West Ave
- 728 James St
- 935 James St
- 912 Washington St NW
- 922 James St
- 906 Washington St NW
- 834 Washington St NW
- 830 Washington St NW
- 733 James St
- 934 James St
- 344 West Ave
- 867 Washington St SW
- 920 Washington St NW
- 920 NW Washington Corner NW
Your Personal Tour Guide
Ask me questions while you tour the home.