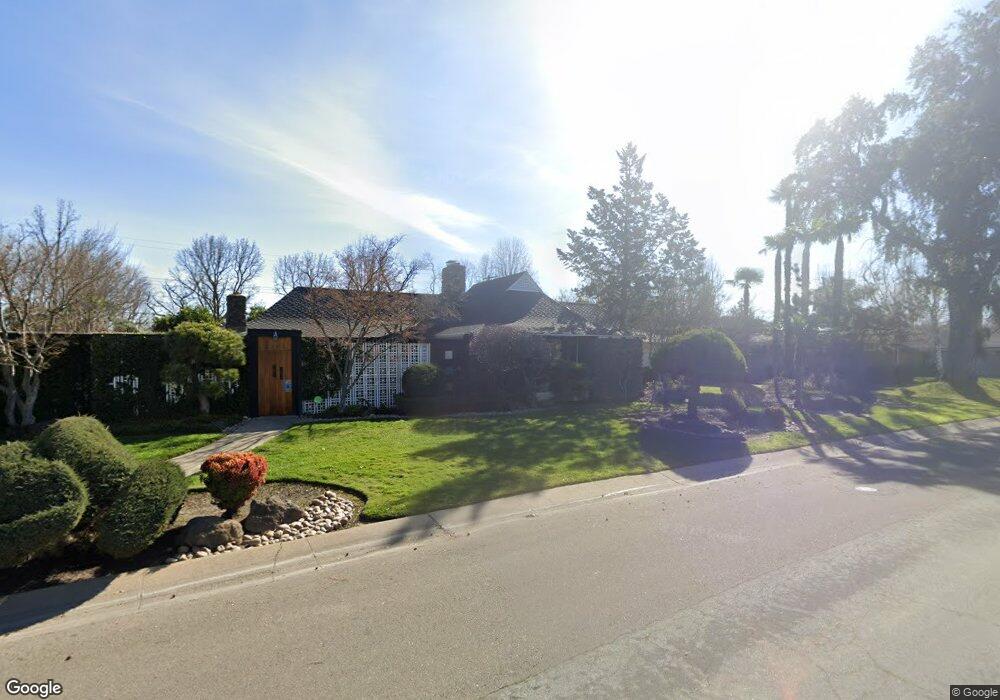
2361 Cabrillo Cir Lodi, CA 95242
Sunwest NeighborhoodEstimated Value: $812,000 - $905,176
3
Beds
4
Baths
3,271
Sq Ft
$265/Sq Ft
Est. Value
About This Home
This home is located at 2361 Cabrillo Cir, Lodi, CA 95242 and is currently estimated at $868,294, approximately $265 per square foot. 2361 Cabrillo Cir is a home located in San Joaquin County with nearby schools including Vinewood Elementary School, Millswood Middle School, and Lodi High School.
Ownership History
Date
Name
Owned For
Owner Type
Purchase Details
Closed on
Mar 16, 2015
Sold by
Hill James E and Hill Lisa M
Bought by
The James & Lisa Hill Family Trust and Hill Lisa M
Current Estimated Value
Purchase Details
Closed on
Jul 15, 2002
Sold by
Sweeney James M and Sweeney Ruth S
Bought by
Hill James E and Hill Lisa M
Home Financials for this Owner
Home Financials are based on the most recent Mortgage that was taken out on this home.
Original Mortgage
$400,000
Outstanding Balance
$169,327
Interest Rate
6.69%
Estimated Equity
$698,967
Purchase Details
Closed on
Dec 16, 1993
Sold by
Sweeney James M and Sweeney Ruth S
Bought by
Sweeney James M and Sweeney Ruth S
Home Financials for this Owner
Home Financials are based on the most recent Mortgage that was taken out on this home.
Original Mortgage
$140,000
Interest Rate
7.2%
Create a Home Valuation Report for This Property
The Home Valuation Report is an in-depth analysis detailing your home's value as well as a comparison with similar homes in the area
Home Values in the Area
Average Home Value in this Area
Purchase History
| Date | Buyer | Sale Price | Title Company |
|---|---|---|---|
| The James & Lisa Hill Family Trust | -- | None Available | |
| Hill James E | $500,000 | Old Republic Title Company | |
| Sweeney James M | -- | Old Republic Title Co |
Source: Public Records
Mortgage History
| Date | Status | Borrower | Loan Amount |
|---|---|---|---|
| Open | Hill James E | $400,000 | |
| Previous Owner | Sweeney James M | $140,000 | |
| Closed | Hill James E | $50,000 |
Source: Public Records
Tax History
| Year | Tax Paid | Tax Assessment Tax Assessment Total Assessment is a certain percentage of the fair market value that is determined by local assessors to be the total taxable value of land and additions on the property. | Land | Improvement |
|---|---|---|---|---|
| 2025 | $7,769 | $724,122 | $217,235 | $506,887 |
| 2024 | $7,556 | $709,925 | $212,976 | $496,949 |
| 2023 | $7,467 | $696,005 | $208,800 | $487,205 |
| 2022 | $7,300 | $682,358 | $204,706 | $477,652 |
| 2021 | $7,431 | $668,980 | $200,693 | $468,287 |
| 2020 | $7,237 | $662,122 | $198,636 | $463,486 |
| 2019 | $7,166 | $649,141 | $194,742 | $454,399 |
| 2018 | $7,066 | $636,414 | $190,924 | $445,490 |
| 2017 | $6,909 | $623,936 | $187,181 | $436,755 |
| 2016 | $6,476 | $611,706 | $183,512 | $428,194 |
| 2015 | $6,408 | $602,520 | $180,756 | $421,764 |
| 2014 | $6,318 | $590,720 | $177,216 | $413,504 |
Source: Public Records
Map
Nearby Homes
- 2337 Corbin Ln
- 2585 Central Park Dr
- 2344 W Tokay St
- 2483 Macarthur Pkwy
- 2410 Central Park Dr
- 835 Kramer Dr
- 2665 Buttercup Dr
- 872 Westwind Dr
- 198 Cottage Ln
- 2432 W Vine St
- 18 Benson Dr
- 2312 Burton Way
- 2025 W Vine St
- The Poppy Plan at Rose Gate - Chelsea Collection
- The Poplar II Plan at Rose Gate - Carrousel Collection
- The Bayberry Plan at Rose Gate - Carrousel Collection
- The Terrace Plan at Rose Gate - Chelsea Collection
- The Hawthorn Plan at Rose Gate - Carrousel Collection
- Lavender Plan at Rose Gate - Carrousel Collection
- The Barcelona Plan at Rose Gate - Chelsea Collection
- 341 La Vida Dr
- 2373 Cabrillo Cir
- 2351 Cabrillo Cir
- 331 La Vida Dr
- 2331 Cabrillo Cir
- 2364 Cabrillo Cir
- 2368 Cabrillo Cir
- 321 La Vida Dr
- 2356 Cabrillo Cir
- 2375 Cabrillo Cir
- 2370 Cabrillo Cir
- 344 La Vida Dr
- 2336 Cabrillo Cir
- 2330 Cabrillo Cir
- 334 La Vida Dr
- 2350 Cabrillo Cir
- 311 La Vida Dr
- 354 La Vida Dr
- 2344 Cabrillo Cir
- 354 S Lower Sacramento Rd