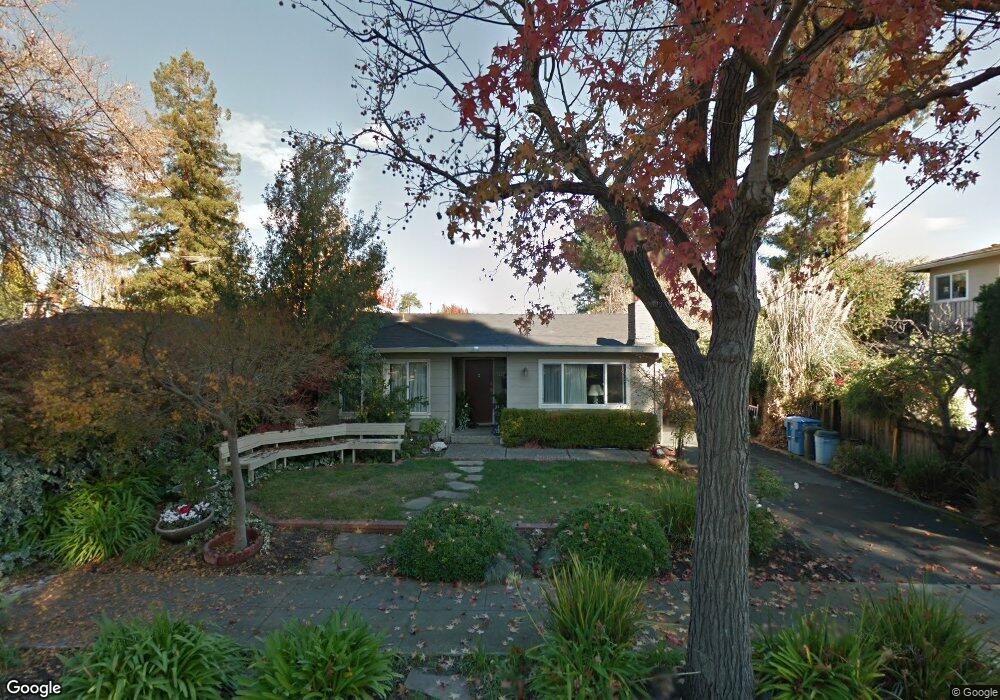
2361 High St Palo Alto, CA 94301
Old Palo Alto NeighborhoodEstimated Value: $3,309,000 - $4,201,000
3
Beds
3
Baths
1,536
Sq Ft
$2,401/Sq Ft
Est. Value
About This Home
This home is located at 2361 High St, Palo Alto, CA 94301 and is currently estimated at $3,687,209, approximately $2,400 per square foot. 2361 High St is a home located in Santa Clara County with nearby schools including Walter Hays Elementary, Frank S. Greene Jr. Middle, and Palo Alto High School.
Ownership History
Date
Name
Owned For
Owner Type
Purchase Details
Closed on
Dec 18, 2020
Sold by
Bao Allen H and Bao Cindy L
Bought by
Bao Allen H and Bao Cindy Linghwa
Current Estimated Value
Home Financials for this Owner
Home Financials are based on the most recent Mortgage that was taken out on this home.
Original Mortgage
$714,000
Outstanding Balance
$636,806
Interest Rate
2.8%
Mortgage Type
New Conventional
Estimated Equity
$3,050,403
Purchase Details
Closed on
Sep 18, 2015
Sold by
Bao Allen H and Bao Cindy L
Bought by
The Allen & Cindy Bao Family Trust and Bao Cindy Linghwa
Purchase Details
Closed on
Jul 21, 2007
Sold by
Adolescent Counseling Services
Bought by
Bao Allen H and Bao Cindy L
Home Financials for this Owner
Home Financials are based on the most recent Mortgage that was taken out on this home.
Original Mortgage
$880,300
Interest Rate
6.5%
Mortgage Type
Purchase Money Mortgage
Create a Home Valuation Report for This Property
The Home Valuation Report is an in-depth analysis detailing your home's value as well as a comparison with similar homes in the area
Home Values in the Area
Average Home Value in this Area
Purchase History
| Date | Buyer | Sale Price | Title Company |
|---|---|---|---|
| Bao Allen H | -- | First American Title Company | |
| Bao Allen H | -- | First American Title | |
| The Allen & Cindy Bao Family Trust | -- | None Available | |
| Bao Allen H | -- | Chicago Title Company |
Source: Public Records
Mortgage History
| Date | Status | Borrower | Loan Amount |
|---|---|---|---|
| Open | Bao Allen H | $714,000 | |
| Previous Owner | Bao Allen H | $880,300 |
Source: Public Records
Tax History Compared to Growth
Tax History
| Year | Tax Paid | Tax Assessment Tax Assessment Total Assessment is a certain percentage of the fair market value that is determined by local assessors to be the total taxable value of land and additions on the property. | Land | Improvement |
|---|---|---|---|---|
| 2025 | $19,058 | $1,651,079 | $1,576,217 | $74,862 |
| 2024 | $19,058 | $1,618,706 | $1,545,311 | $73,395 |
| 2023 | $18,779 | $1,586,967 | $1,515,011 | $71,956 |
| 2022 | $18,564 | $1,555,851 | $1,485,305 | $70,546 |
| 2021 | $18,196 | $1,525,345 | $1,456,182 | $69,163 |
| 2020 | $17,809 | $1,509,705 | $1,441,251 | $68,454 |
| 2019 | $18,436 | $1,480,104 | $1,412,992 | $67,112 |
| 2018 | $17,937 | $1,451,084 | $1,385,287 | $65,797 |
| 2017 | $17,620 | $1,422,632 | $1,358,125 | $64,507 |
| 2016 | $17,155 | $1,394,739 | $1,331,496 | $63,243 |
| 2015 | $16,984 | $1,373,790 | $1,311,496 | $62,294 |
| 2014 | $16,604 | $1,346,880 | $1,285,806 | $61,074 |
Source: Public Records
Map
Nearby Homes
- 151 Colorado Ave
- 2573 Park Blvd Unit U204
- 2399 South Ct
- 200 Sheridan Ave Unit 304
- 200 Sheridan Ave Unit 303
- 200 Sheridan Ave Unit 103
- 200 Sheridan Ave Unit 307
- 425 Grant Ave Unit 19
- 1932 Emerson St
- 410 Sheridan Ave Unit 446
- 184 Tennyson Ave
- 5 Plan at Acacia
- 4X Plan at Acacia
- 4 Plan at Acacia
- 3 Plan at Acacia
- 2A Plan at Acacia
- 2 Plan at Acacia
- 1 Plan at Acacia
- 444 Tennyson Ave
- 2590 Webster St
- 159 Oregon Ave
- 151 Oregon Ave
- 2331 High St
- 167 Oregon Ave
- 2360 Emerson St
- 2344 Emerson St
- 175 Oregon Ave
- 2330 Emerson St
- 2380 Emerson St
- 160 Nevada Ave
- 150 Nevada Ave
- 170 Nevada Ave
- 180 Nevada Ave
- 2300 Emerson St
- 2365 Emerson St
- 2351 Emerson St
- 2381 Emerson St
- 2339 Emerson St
- 2325 Emerson St
- 209 Oregon Ave