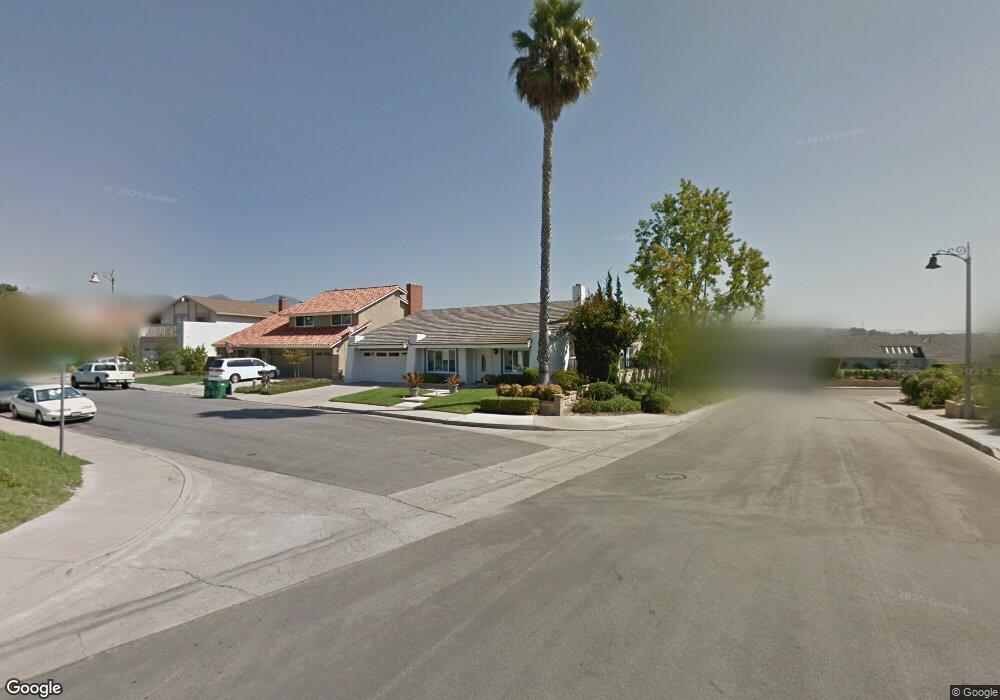
23622 Via Breve Mission Viejo, CA 92691
Estimated Value: $1,340,717 - $1,421,000
3
Beds
2
Baths
1,854
Sq Ft
$743/Sq Ft
Est. Value
About This Home
This home is located at 23622 Via Breve, Mission Viejo, CA 92691 and is currently estimated at $1,377,929, approximately $743 per square foot. 23622 Via Breve is a home located in Orange County with nearby schools including Castille Elementary School, Newhart Middle School, and Capistrano Valley High School.
Ownership History
Date
Name
Owned For
Owner Type
Purchase Details
Closed on
Aug 31, 2015
Sold by
Shoemaker John C and Shoemaker Carolyn
Bought by
John and Famil Shoemaker Revocable Famil
Current Estimated Value
Purchase Details
Closed on
Oct 18, 2002
Sold by
Potesanos Chris and Potesanos Eva
Bought by
Shoemaker John C and Shoemaker Carolyn
Home Financials for this Owner
Home Financials are based on the most recent Mortgage that was taken out on this home.
Original Mortgage
$250,000
Outstanding Balance
$103,200
Interest Rate
5.95%
Estimated Equity
$1,274,729
Purchase Details
Closed on
Sep 25, 2002
Sold by
Potesanos Anthony H
Bought by
Potesanos Chris and Potesanos Eva
Home Financials for this Owner
Home Financials are based on the most recent Mortgage that was taken out on this home.
Original Mortgage
$250,000
Outstanding Balance
$103,200
Interest Rate
5.95%
Estimated Equity
$1,274,729
Create a Home Valuation Report for This Property
The Home Valuation Report is an in-depth analysis detailing your home's value as well as a comparison with similar homes in the area
Home Values in the Area
Average Home Value in this Area
Purchase History
| Date | Buyer | Sale Price | Title Company |
|---|---|---|---|
| John | -- | None Available | |
| Shoemaker John C | $440,000 | First American Title Co | |
| Potesanos Chris | -- | First American Title Co |
Source: Public Records
Mortgage History
| Date | Status | Borrower | Loan Amount |
|---|---|---|---|
| Open | Shoemaker John C | $250,000 |
Source: Public Records
Tax History Compared to Growth
Tax History
| Year | Tax Paid | Tax Assessment Tax Assessment Total Assessment is a certain percentage of the fair market value that is determined by local assessors to be the total taxable value of land and additions on the property. | Land | Improvement |
|---|---|---|---|---|
| 2025 | $6,269 | $637,259 | $485,946 | $151,313 |
| 2024 | $6,269 | $624,764 | $476,417 | $148,347 |
| 2023 | $6,135 | $612,514 | $467,075 | $145,439 |
| 2022 | $6,017 | $600,504 | $457,916 | $142,588 |
| 2021 | $5,900 | $588,730 | $448,937 | $139,793 |
| 2020 | $5,840 | $582,694 | $444,334 | $138,360 |
| 2019 | $5,724 | $571,269 | $435,621 | $135,648 |
| 2018 | $5,613 | $560,068 | $427,079 | $132,989 |
| 2017 | $5,502 | $549,087 | $418,705 | $130,382 |
| 2016 | $5,395 | $538,321 | $410,495 | $127,826 |
| 2015 | $5,330 | $530,235 | $404,329 | $125,906 |
| 2014 | $5,226 | $519,849 | $396,409 | $123,440 |
Source: Public Records
Map
Nearby Homes
- 27241 Via Burgos
- 23431 Via Guadix
- 27301 Via Avila
- 23382 Via Chiripa
- 23502 Coso Unit 193
- 23266 Via Ronda
- 23336 Via Bahia
- 23251 Via Guadix
- 23224 Coso Unit 51
- 23552 Bermuda Dunes
- 27705 Via Rodrigo
- 23247 Cherry Hills St
- 27382 Via Cortez
- 22982 Cecelia
- 26702 Via Linares
- 23902 Via Lugones
- 23631 Via Storni
- 27805 Barbate Unit 15
- 27695 Via Turina
- 26812 Via Llano
- 23612 Via Breve
- 23602 Via Breve
- 27311 Via Burgos
- 27332 Via Burgos
- 27342 Via Burgos
- 27322 Via Burgos
- 23632 Via Chiripa
- 23642 Via Chiripa
- 23592 Via Breve
- 23622 Via Chiripa
- 27301 Via Burgos
- 23652 Via Chiripa
- 27312 Via Burgos
- 23671 Via Chiripa
- 23612 Via Chiripa
- 23662 Via Chiripa
- 23582 Via Breve
- 23662 Via Astorga
- 27291 Via Burgos
- 23681 Via Chiripa