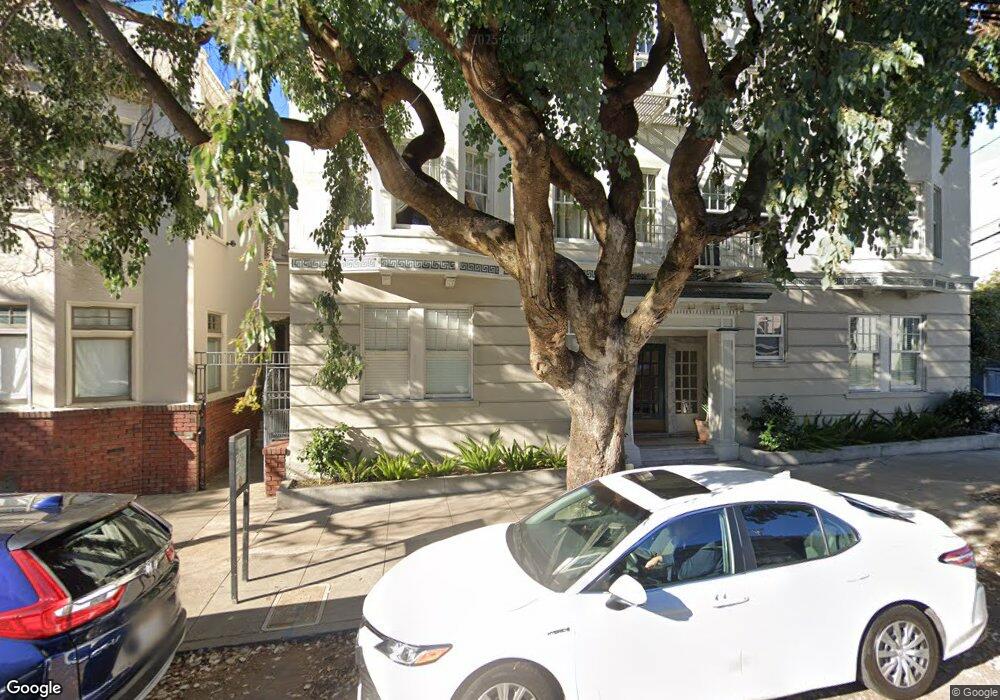
2363 Larkin St Unit 41 San Francisco, CA 94109
Russian Hill NeighborhoodEstimated Value: $839,000 - $1,141,000
1
Bed
1
Bath
800
Sq Ft
$1,216/Sq Ft
Est. Value
About This Home
This home is located at 2363 Larkin St Unit 41, San Francisco, CA 94109 and is currently estimated at $973,176, approximately $1,216 per square foot. 2363 Larkin St Unit 41 is a home located in San Francisco County with nearby schools including Yick Wo Elementary School, Francisco Middle School, and Saint Brigid Academy.
Ownership History
Date
Name
Owned For
Owner Type
Purchase Details
Closed on
Aug 17, 2023
Sold by
Lassettre Neil S and Lassettre Monica E
Bought by
Neil & Monica Lassettre Trust and Lassettre
Current Estimated Value
Purchase Details
Closed on
Jul 5, 2012
Sold by
Lassettre Edwin R and Lassettre Pauline E
Bought by
Lassettre Nell S and Lassettre Monica E
Home Financials for this Owner
Home Financials are based on the most recent Mortgage that was taken out on this home.
Original Mortgage
$100,000
Interest Rate
3.65%
Mortgage Type
Credit Line Revolving
Purchase Details
Closed on
Feb 25, 2009
Sold by
Lassettre Neil S and Lassettre Monica E
Bought by
Lassettre Neil S and Lassettre Monica E
Home Financials for this Owner
Home Financials are based on the most recent Mortgage that was taken out on this home.
Original Mortgage
$455,000
Interest Rate
5.08%
Mortgage Type
New Conventional
Purchase Details
Closed on
May 11, 2006
Sold by
Lassettre Edwin and Lassettre Pauline
Bought by
Lassettre Edwin R and Lassettre Pauline E
Purchase Details
Closed on
Aug 2, 2005
Sold by
Johnson Martha A
Bought by
Lassettre Neil and Lassettre Monica
Home Financials for this Owner
Home Financials are based on the most recent Mortgage that was taken out on this home.
Original Mortgage
$449,000
Interest Rate
5.37%
Mortgage Type
Purchase Money Mortgage
Purchase Details
Closed on
May 28, 2004
Sold by
Johnson Martha A and Mastracci Mark R
Bought by
Johnson Martha A
Home Financials for this Owner
Home Financials are based on the most recent Mortgage that was taken out on this home.
Original Mortgage
$150,000
Interest Rate
6.09%
Mortgage Type
New Conventional
Purchase Details
Closed on
Apr 29, 1998
Sold by
Goldman Anne
Bought by
Goldman Nadine P
Home Financials for this Owner
Home Financials are based on the most recent Mortgage that was taken out on this home.
Original Mortgage
$311,200
Interest Rate
7.12%
Purchase Details
Closed on
Apr 27, 1998
Sold by
Goldman Nadine P
Bought by
Johnson Martha A
Home Financials for this Owner
Home Financials are based on the most recent Mortgage that was taken out on this home.
Original Mortgage
$311,200
Interest Rate
7.12%
Purchase Details
Closed on
Feb 13, 1997
Sold by
Goldman Anne
Bought by
Goldman Nadine P
Purchase Details
Closed on
Dec 17, 1996
Sold by
Goldman Nadine P and Donald Goldman
Bought by
Goldman Nadine P
Create a Home Valuation Report for This Property
The Home Valuation Report is an in-depth analysis detailing your home's value as well as a comparison with similar homes in the area
Home Values in the Area
Average Home Value in this Area
Purchase History
| Date | Buyer | Sale Price | Title Company |
|---|---|---|---|
| Neil & Monica Lassettre Trust | -- | None Listed On Document | |
| Lassettre Nell S | $335,000 | Fidelity National Title Co | |
| Lassettre Neil S | -- | Fidelity National Title Co | |
| Lassettre Edwin R | -- | None Available | |
| Lassettre Neil | $699,000 | Fidelity National Title Co | |
| Johnson Martha A | -- | First American Title Company | |
| Goldman Nadine P | -- | First American Title Co | |
| Johnson Martha A | -- | First American Title Co | |
| Goldman Nadine P | -- | First American Title Co | |
| Goldman Nadine P | -- | -- | |
| Goldman Nadine P | -- | -- |
Source: Public Records
Mortgage History
| Date | Status | Borrower | Loan Amount |
|---|---|---|---|
| Previous Owner | Lassettre Nell S | $100,000 | |
| Previous Owner | Lassettre Nell S | $417,000 | |
| Previous Owner | Lassettre Neil S | $455,000 | |
| Previous Owner | Lassettre Neil | $449,000 | |
| Previous Owner | Johnson Martha A | $150,000 | |
| Previous Owner | Johnson Martha A | $311,200 | |
| Closed | Johnson Martha A | $38,900 |
Source: Public Records
Tax History Compared to Growth
Tax History
| Year | Tax Paid | Tax Assessment Tax Assessment Total Assessment is a certain percentage of the fair market value that is determined by local assessors to be the total taxable value of land and additions on the property. | Land | Improvement |
|---|---|---|---|---|
| 2025 | $11,062 | $890,119 | $486,313 | $403,806 |
| 2024 | $11,062 | $872,667 | $476,778 | $395,889 |
| 2023 | $10,794 | $855,558 | $467,430 | $388,128 |
| 2022 | $10,576 | $838,785 | $458,266 | $380,519 |
| 2021 | $10,385 | $822,340 | $449,281 | $373,059 |
| 2020 | $10,441 | $813,909 | $444,675 | $369,234 |
| 2019 | $10,085 | $797,952 | $435,957 | $361,995 |
| 2018 | $9,746 | $782,308 | $427,410 | $354,898 |
| 2017 | $9,332 | $766,970 | $419,030 | $347,940 |
| 2016 | $9,167 | $751,934 | $410,815 | $341,119 |
| 2015 | $9,052 | $740,641 | $404,645 | $335,996 |
| 2014 | $8,813 | $726,134 | $396,719 | $329,415 |
Source: Public Records
Map
Nearby Homes
- 2363 Larkin St Unit 34
- 2111 Hyde St Unit 505
- 2111 Hyde St Unit 403
- 1380 Greenwich St Unit 205
- 1380 Greenwich St Unit 203
- 1405 Greenwich St Unit 3
- 1275 Lombard St
- 1728 Larkin St
- 16 Delgado Place
- 1268 Lombard St Unit 1
- 1100 Union St Unit 1000
- 1100 Union St Unit 1100
- 2145 Larkin St
- 1438 Green St Unit 3D
- 1925 Leavenworth St Unit 7
- 1145 Green St Unit 3
- 1080 Chestnut St Unit 11C
- 1080 Chestnut St Unit 11B
- 1080 Chestnut St Unit 1B
- 1135 Green St
- 2363 Larkin St Unit 23
- 2363 Larkin St Unit 22
- 2363 Larkin St Unit 21
- 2363 Larkin St Unit 4
- 2363 Larkin St Unit 3
- 2363 Larkin St Unit 2
- 2363 Larkin St Unit 1
- 2363 Larkin St Unit 44
- 2363 Larkin St Unit 43
- 2363 Larkin St Unit 42
- 2363 Larkin St Unit 33
- 2363 Larkin St Unit 31
- 2363 Larkin St Unit 24
- 2353 Larkin St
- 2351 Larkin St
- 2345 Larkin St
- 1327 Filbert St Unit 1327
- 1325 Filbert St
- 2405 Larkin St Unit 2405A
- 1335 Filbert St Unit 306