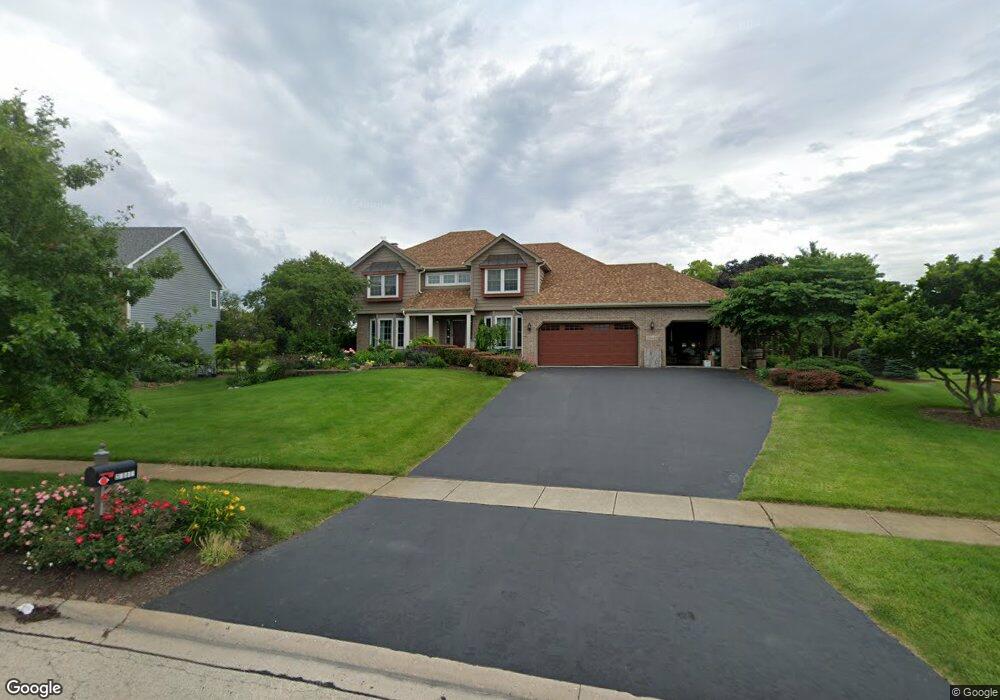
23643 Royal Worlington Dr Naperville, IL 60564
Crestview Knoll NeighborhoodEstimated Value: $685,342 - $864,000
4
Beds
3
Baths
2,844
Sq Ft
$273/Sq Ft
Est. Value
About This Home
This home is located at 23643 Royal Worlington Dr, Naperville, IL 60564 and is currently estimated at $775,836, approximately $272 per square foot. 23643 Royal Worlington Dr is a home located in Will County with nearby schools including Oliver Julian Kendall Elementary School, Ellsworth Elementary School, and Clifford Crone Middle School.
Ownership History
Date
Name
Owned For
Owner Type
Purchase Details
Closed on
Jun 10, 2006
Sold by
Adamski John D and Adamski Laura G
Bought by
Cai Yigang and Lin Xiaochun
Current Estimated Value
Home Financials for this Owner
Home Financials are based on the most recent Mortgage that was taken out on this home.
Original Mortgage
$300,000
Interest Rate
6.68%
Mortgage Type
Purchase Money Mortgage
Purchase Details
Closed on
May 28, 1998
Sold by
Brown Timothy Roy and Brown Kathleen Marie
Bought by
Adamski John D and Adamski Laura G
Home Financials for this Owner
Home Financials are based on the most recent Mortgage that was taken out on this home.
Original Mortgage
$227,100
Interest Rate
7.22%
Purchase Details
Closed on
Sep 12, 1994
Sold by
Harris Bank Naperville
Bought by
Brown Timothy Ray and Brown Kathleen Marie
Home Financials for this Owner
Home Financials are based on the most recent Mortgage that was taken out on this home.
Original Mortgage
$238,500
Interest Rate
7.75%
Create a Home Valuation Report for This Property
The Home Valuation Report is an in-depth analysis detailing your home's value as well as a comparison with similar homes in the area
Home Values in the Area
Average Home Value in this Area
Purchase History
| Date | Buyer | Sale Price | Title Company |
|---|---|---|---|
| Cai Yigang | $575,000 | Burnet Title Llc | |
| Adamski John D | $304,000 | -- | |
| Brown Timothy Ray | $299,000 | Chicago Title Insurance Co |
Source: Public Records
Mortgage History
| Date | Status | Borrower | Loan Amount |
|---|---|---|---|
| Closed | Cai Yigang | $300,000 | |
| Previous Owner | Adamski John D | $227,100 | |
| Previous Owner | Brown Timothy Ray | $238,500 |
Source: Public Records
Tax History Compared to Growth
Tax History
| Year | Tax Paid | Tax Assessment Tax Assessment Total Assessment is a certain percentage of the fair market value that is determined by local assessors to be the total taxable value of land and additions on the property. | Land | Improvement |
|---|---|---|---|---|
| 2024 | $11,852 | $197,892 | $44,185 | $153,707 |
| 2023 | $11,852 | $174,817 | $39,033 | $135,784 |
| 2022 | $11,122 | $165,374 | $36,924 | $128,450 |
| 2021 | $10,406 | $157,499 | $35,166 | $122,333 |
| 2020 | $10,384 | $155,004 | $34,609 | $120,395 |
| 2019 | $10,190 | $150,636 | $33,634 | $117,002 |
| 2018 | $11,058 | $154,426 | $32,894 | $121,532 |
| 2017 | $10,911 | $150,440 | $32,045 | $118,395 |
| 2016 | $10,865 | $147,201 | $31,355 | $115,846 |
| 2015 | $10,794 | $141,539 | $30,149 | $111,390 |
| 2014 | $10,794 | $139,049 | $30,149 | $108,900 |
| 2013 | $10,794 | $139,049 | $30,149 | $108,900 |
Source: Public Records
Map
Nearby Homes
- 2711 Wait Rd
- 2255 Wendt Cir
- 29W316 Andermann Dr
- 1736 Robert Ln
- 1804 Princess Cir
- 3707 Junebreeze Ln
- 11110 Highland Dr
- 26106 W Sherwood Cir
- 23234 W Allagash Dr
- 24024 W Champion Dr
- 11319 Maplewood Dr
- 3616 Eliot Ln
- 24531 W 103rd St
- 3432 Redwing Dr Unit 2
- 2539 Mallet Ct
- 2543 Mallet Ct
- 2547 Mallet Ct
- 2519 Mallet Ct
- 3740 Ryder Ct
- 2419 Lawlor Ln
- 23633 W Royal Worlington Dr
- 23633 W Royal Worlington Dr
- 23651 W Royal Worlington Dr
- 2507 Freeland Ct
- 2511 Freeland Ct
- 2503 Freeland Ct
- 23661 Royal Worlington Dr
- 2515 Freeland Ct
- 23648 Royal Worlington Dr
- 2504 Freeland Ct Unit 4
- 2519 Freeland Ct
- 2519 Freeland Ct Unit 4
- 23624 W Deer Chase Ln
- 23707 Royal Worlington Dr
- 23625 Deer Chase Ln
- 10627 Quail Ridge Ct
- 2508 Freeland Ct
- 2512 Freeland Ct
- 2523 Freeland Ct Unit 4
- 2516 Freeland Ct