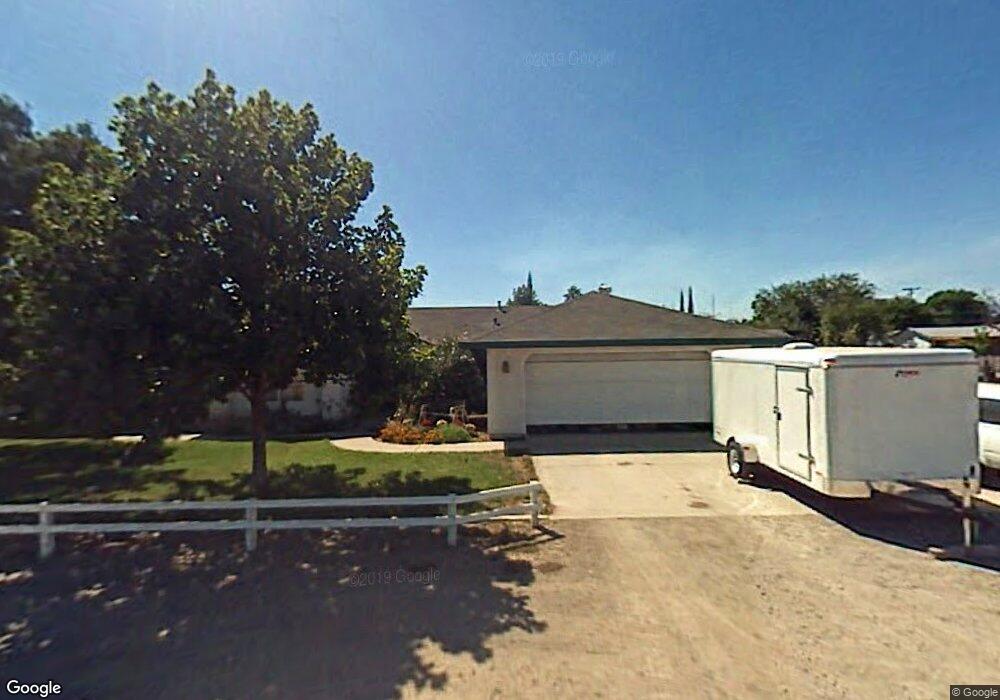
2366 Locust St Sutter, CA 95982
Estimated Value: $396,622 - $423,000
4
Beds
2
Baths
1,396
Sq Ft
$295/Sq Ft
Est. Value
About This Home
This home is located at 2366 Locust St, Sutter, CA 95982 and is currently estimated at $412,156, approximately $295 per square foot. 2366 Locust St is a home located in Sutter County with nearby schools including Brittan Elementary School, Sutter High School, and Christian Outreach Fellowship.
Ownership History
Date
Name
Owned For
Owner Type
Purchase Details
Closed on
Oct 17, 2011
Sold by
Fannie Mae
Bought by
Norman Robert and Norman Kim
Current Estimated Value
Home Financials for this Owner
Home Financials are based on the most recent Mortgage that was taken out on this home.
Original Mortgage
$170,465
Outstanding Balance
$115,983
Interest Rate
4.05%
Mortgage Type
FHA
Estimated Equity
$296,173
Purchase Details
Closed on
Jun 16, 2011
Sold by
Molennor Troy S and Molennor Amy E
Bought by
Federal National Mortgage Association
Purchase Details
Closed on
Jun 6, 2006
Sold by
Furr Richard L and Furr Rhonda G
Bought by
Molennor Troy S and Molennor Amy E
Home Financials for this Owner
Home Financials are based on the most recent Mortgage that was taken out on this home.
Original Mortgage
$65,000
Interest Rate
6.55%
Mortgage Type
Credit Line Revolving
Create a Home Valuation Report for This Property
The Home Valuation Report is an in-depth analysis detailing your home's value as well as a comparison with similar homes in the area
Home Values in the Area
Average Home Value in this Area
Purchase History
| Date | Buyer | Sale Price | Title Company |
|---|---|---|---|
| Norman Robert | $175,000 | North State Title Company | |
| Federal National Mortgage Association | $256,522 | None Available | |
| Molennor Troy S | $325,000 | Placer Title Company |
Source: Public Records
Mortgage History
| Date | Status | Borrower | Loan Amount |
|---|---|---|---|
| Open | Norman Robert | $170,465 | |
| Previous Owner | Molennor Troy S | $65,000 | |
| Previous Owner | Molennor Troy S | $260,000 |
Source: Public Records
Tax History
| Year | Tax Paid | Tax Assessment Tax Assessment Total Assessment is a certain percentage of the fair market value that is determined by local assessors to be the total taxable value of land and additions on the property. | Land | Improvement |
|---|---|---|---|---|
| 2025 | $2,349 | $219,674 | $37,676 | $181,998 |
| 2024 | $2,349 | $215,368 | $36,938 | $178,430 |
| 2023 | $2,349 | $211,146 | $36,214 | $174,932 |
| 2022 | $2,278 | $207,006 | $35,504 | $171,502 |
| 2021 | $2,257 | $202,955 | $34,812 | $168,143 |
| 2020 | $2,229 | $200,874 | $34,455 | $166,419 |
| 2019 | $2,163 | $196,936 | $33,780 | $163,156 |
| 2018 | $2,141 | $193,074 | $33,117 | $159,957 |
| 2017 | $2,021 | $189,287 | $32,468 | $156,819 |
| 2016 | $2,006 | $185,576 | $31,831 | $153,745 |
Source: Public Records
Map
Nearby Homes
- 2371 Elm St
- 7669 Barrow St
- 2431 Madrone St
- 2227 W Ridge Dr
- 2211 W Ridge Dr
- 2185 Perry St
- 1939 1st Ave
- 8617 S Butte Rd
- 1244 Acacia Ave
- 5576 S Butte Rd
- 8454 Pass Rd
- 8970 S Butte Rd
- 2065 Howlett Ave
- 4423 Dresser Rd
- 4361 Dresser Rd
- 1270 Tulio St
- 1803 Lynchburg Dr
- 3295 Jefferson Ave
- 3327 Sam Brannan Way
- 2127 Pepperwood Dr
- 2340 Locust St
- 7034 Barrow St
- 7038 Barrow St
- 2355 Mulberry St
- 2371 Mulberry St
- 2369 Mulberry St
- 2341 Mulberry St
- 0 Locust St
- 2389 Mulberry St
- 7041 Washington St
- 2329 Mulberry St
- 2319 Mulberry St
- 2404 Locust St
- 7011 Washington St
- 0 Mulberry St
- 2407 Mulberry St
- 2364 Mulberry St
- 2350 Mulberry St
- 2336 Mulberry St
- 7130 Barrow St
Your Personal Tour Guide
Ask me questions while you tour the home.