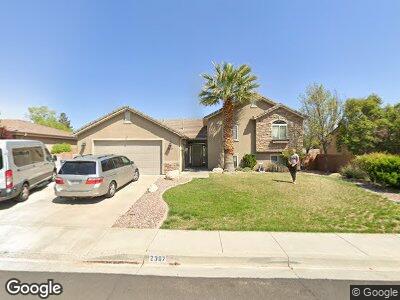
2367 E 440 Cir N St. George, UT 84790
Estimated Value: $568,000 - $687,000
5
Beds
4
Baths
2,871
Sq Ft
$211/Sq Ft
Est. Value
About This Home
This home is located at 2367 E 440 Cir N, St. George, UT 84790 and is currently estimated at $604,364, approximately $210 per square foot. 2367 E 440 Cir N is a home located in Washington County with nearby schools including Panorama School, Pine View Middle School, and Fossil Ridge Intermediate School.
Ownership History
Date
Name
Owned For
Owner Type
Purchase Details
Closed on
May 11, 2011
Sold by
The Bank Of New York Mellon
Bought by
Swensen Derron R and Swensen Tamara W
Current Estimated Value
Home Financials for this Owner
Home Financials are based on the most recent Mortgage that was taken out on this home.
Original Mortgage
$210,524
Interest Rate
4.37%
Mortgage Type
FHA
Purchase Details
Closed on
Dec 17, 2010
Sold by
Grymes Shane and Grymes Trisha
Bought by
The Bank Of New York Mellon and The Bank Of New York
Purchase Details
Closed on
Aug 23, 2005
Sold by
Smith C Greg C and Smith Jolene S
Bought by
Grymes Shane and Grymes Trisha
Home Financials for this Owner
Home Financials are based on the most recent Mortgage that was taken out on this home.
Original Mortgage
$70,000
Interest Rate
5.7%
Mortgage Type
Stand Alone Second
Purchase Details
Closed on
Feb 7, 2005
Sold by
Lamb Clark and Lamb Florene S
Bought by
Lamb Clark and Lamb Florene S
Create a Home Valuation Report for This Property
The Home Valuation Report is an in-depth analysis detailing your home's value as well as a comparison with similar homes in the area
Home Values in the Area
Average Home Value in this Area
Purchase History
| Date | Buyer | Sale Price | Title Company |
|---|---|---|---|
| Swensen Derron R | -- | First American Union Park | |
| The Bank Of New York Mellon | $207,000 | Backman Fptp | |
| Grymes Shane | -- | Sun West Title | |
| Smith C Greg C | -- | Sun West Title | |
| Lamb Clark | -- | First Title Of Utah |
Source: Public Records
Mortgage History
| Date | Status | Borrower | Loan Amount |
|---|---|---|---|
| Open | Swensen Derron R | $204,700 | |
| Closed | Swensen Derron R | $200,500 | |
| Closed | Swensen Derron R | $210,524 | |
| Previous Owner | Grymes Shane | $70,000 | |
| Previous Owner | Grymes Shane | $280,000 |
Source: Public Records
Tax History Compared to Growth
Tax History
| Year | Tax Paid | Tax Assessment Tax Assessment Total Assessment is a certain percentage of the fair market value that is determined by local assessors to be the total taxable value of land and additions on the property. | Land | Improvement |
|---|---|---|---|---|
| 2023 | $2,052 | $306,625 | $52,800 | $253,825 |
| 2022 | $2,183 | $306,680 | $52,250 | $254,430 |
| 2021 | $1,945 | $407,600 | $80,000 | $327,600 |
| 2020 | $1,784 | $352,000 | $60,000 | $292,000 |
| 2019 | $1,780 | $343,100 | $60,000 | $283,100 |
| 2018 | $1,691 | $168,355 | $0 | $0 |
| 2017 | $1,628 | $157,300 | $0 | $0 |
| 2016 | $1,682 | $150,370 | $0 | $0 |
| 2015 | $1,609 | $137,940 | $0 | $0 |
| 2014 | $1,514 | $130,680 | $0 | $0 |
Source: Public Records
Map
Nearby Homes
- 402 N 2370 E
- 345 N 2450 E Unit 236
- 345 N 2450 E Unit 142
- 345 N 2450 E Unit 239
- 345 N 2450 E Unit 193
- 2577 E 430 N
- 280 N Sunflower Dr Unit 25
- 345 N 2450 E Unit 193
- 600 N 2450 E Unit 1903
- 616 N 2330 E
- 271 N 2700 E
- 240 N Sunflower Dr Unit 48
- 240 N Sunflower Dr Unit 48
- 2170 E 575 N
- 675 N 2240 E
- 2071 E 575 N
- 744 N 2380 Cir E
- 2408 E 80 Cir N
- 2843 E 410 St N
- 2720 N 2720 E
- 2367 E 440 Cir N
- 2367 E 440 North Cir
- 2379 E 440 Cir N
- 2379 E 440 North Cir
- 2355 E 440 North Cir
- 2355 E 440 Cir N
- 464 N 2360 E
- 425 N 2370 E
- 2395 E 440 North Cir
- 2339 E 440 North Cir
- 2382 E 440 North Cir
- 2382 E 440 Cir N
- 2346 E 440 North Cir
- 2346 E 440 Cir N
- 461 N 2360 E
- 2392 E 480 North Cir
- 2398 E 480 North Cir
- 476 N 2360 E
- 2396 E 440 North Cir
- 2392 E 480 Cir N