23671 Avenue 9 Madera, CA 93637
Estimated Value: $159,000 - $267,000
3
Beds
1
Bath
868
Sq Ft
$238/Sq Ft
Est. Value
About This Home
This home is located at 23671 Avenue 9, Madera, CA 93637 and is currently estimated at $206,591, approximately $238 per square foot. 23671 Avenue 9 is a home located in Madera County with nearby schools including La Vina Elementary School and Madera South High School.
Ownership History
Date
Name
Owned For
Owner Type
Purchase Details
Closed on
Nov 5, 2020
Sold by
Vaca Ana C
Bought by
Montoya Ventura
Current Estimated Value
Purchase Details
Closed on
Oct 23, 2020
Sold by
Ventura Montoya
Bought by
Ventura Montoya Acosta Living
Purchase Details
Closed on
Oct 27, 1999
Sold by
Moreno Maria L
Bought by
Montoya Ventura and Vaca Ana C
Home Financials for this Owner
Home Financials are based on the most recent Mortgage that was taken out on this home.
Original Mortgage
$63,080
Interest Rate
7.96%
Mortgage Type
FHA
Purchase Details
Closed on
Oct 25, 1999
Sold by
Pistoresi Roselia
Bought by
Moreno Maria L
Home Financials for this Owner
Home Financials are based on the most recent Mortgage that was taken out on this home.
Original Mortgage
$63,080
Interest Rate
7.96%
Mortgage Type
FHA
Purchase Details
Closed on
Apr 27, 1999
Sold by
Associates Financial Svcs Co Of Ca Inc
Bought by
Pistoresi Roselia
Create a Home Valuation Report for This Property
The Home Valuation Report is an in-depth analysis detailing your home's value as well as a comparison with similar homes in the area
Purchase History
| Date | Buyer | Sale Price | Title Company |
|---|---|---|---|
| Ventura Montoya Acosta Living | -- | Lawvex Llp | |
| Montoya Ventura | $64,000 | Chicago Title Co | |
| Moreno Maria L | -- | -- | |
| Pistoresi Roselia | $25,000 | -- | |
| Montoya Ventura | -- | -- |
Source: Public Records
Mortgage History
| Date | Status | Borrower | Loan Amount |
|---|---|---|---|
| Previous Owner | Montoya Ventura | $63,080 |
Source: Public Records
Tax History
| Year | Tax Paid | Tax Assessment Tax Assessment Total Assessment is a certain percentage of the fair market value that is determined by local assessors to be the total taxable value of land and additions on the property. | Land | Improvement |
|---|---|---|---|---|
| 2025 | $768 | $72,211 | $38,413 | $33,798 |
| 2023 | $768 | $69,409 | $36,922 | $32,487 |
| 2022 | $715 | $68,049 | $36,199 | $31,850 |
| 2021 | $701 | $66,716 | $35,490 | $31,226 |
| 2020 | $712 | $66,033 | $35,127 | $30,906 |
| 2019 | $705 | $64,739 | $34,439 | $30,300 |
| 2018 | $649 | $63,470 | $33,764 | $29,706 |
| 2017 | $640 | $62,226 | $33,102 | $29,124 |
| 2016 | $622 | $61,006 | $32,453 | $28,553 |
| 2015 | $603 | $60,091 | $31,966 | $28,125 |
| 2014 | $562 | $58,915 | $31,340 | $27,575 |
Source: Public Records
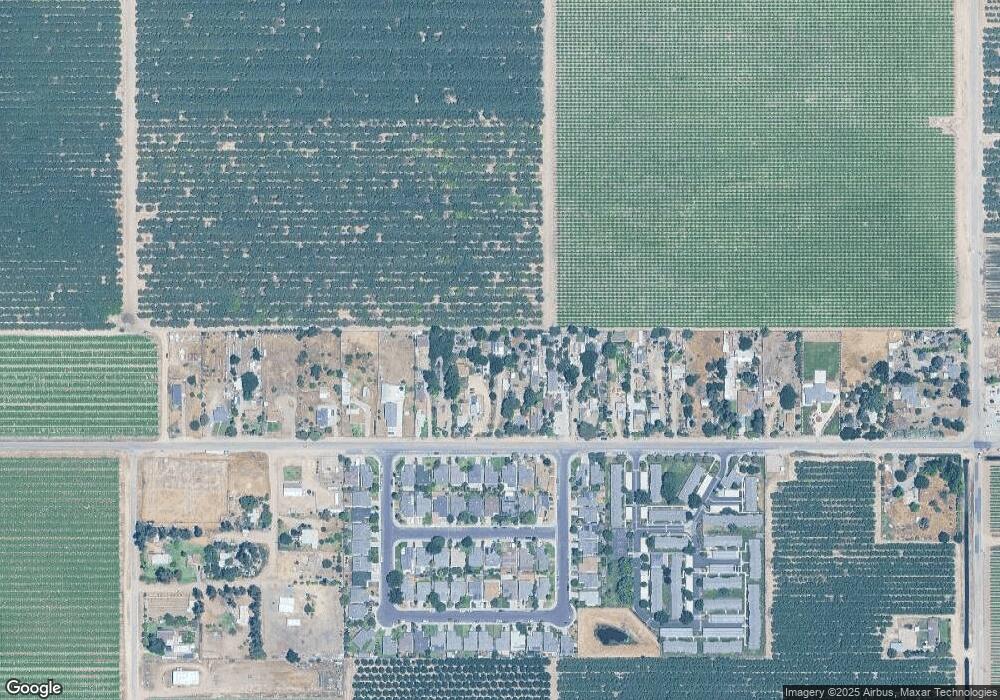
Map
Nearby Homes
- 23663 Las Palmas Ave
- 23663 Uvas Ave
- 7715 Road 23
- 24706 Avenue 8
- 6837 S Granada Dr
- 0 Avenue 7
- 0 Road 26 Unit 640411
- 16388 Avenue 18 1 2
- 0 Airport Drive & Avenue 17 Unit 226020264
- 0 Airport Drive & Avenue 17 Unit MC26038349
- 5394 Road 24 1 2
- 7517 Highway 145
- 5108 Road 25
- 1207 Via Valencia
- 23326 Avenue 13
- 6286 Road 27
- 0 Road 28 Unit 633748
- 3108 Capistrano Dr
- 294 Double Tree Ct
- 220 S Double Tree Way
Your Personal Tour Guide
Ask me questions while you tour the home.