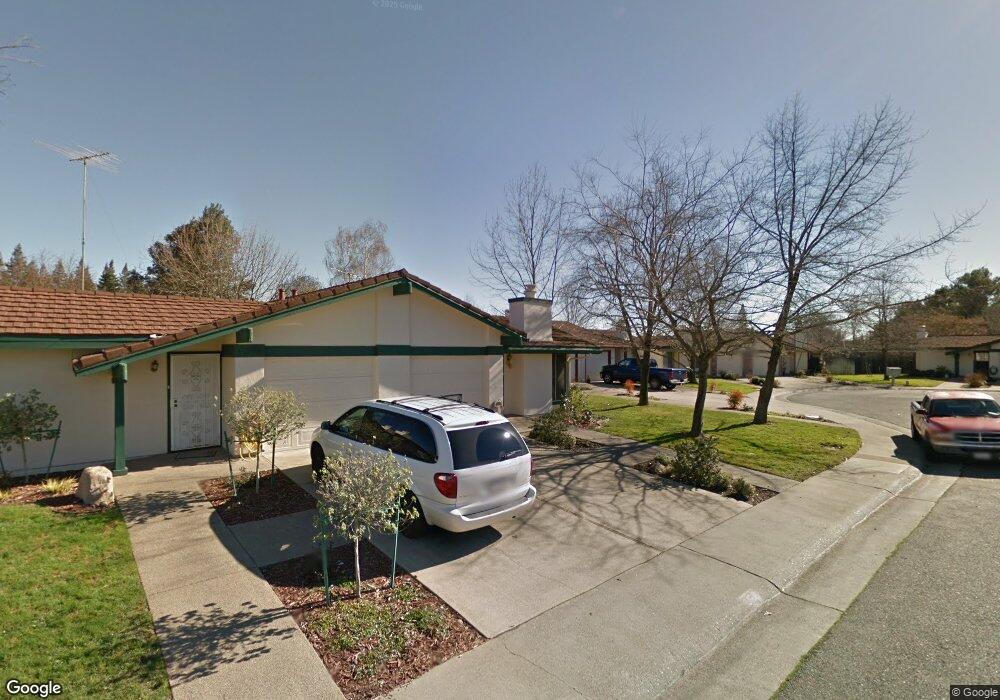
2369 Cobbleoak Ct Unit 91 Rancho Cordova, CA 95670
Walnut Wood NeighborhoodEstimated Value: $320,617 - $345,000
3
Beds
2
Baths
1,217
Sq Ft
$274/Sq Ft
Est. Value
About This Home
This home is located at 2369 Cobbleoak Ct Unit 91, Rancho Cordova, CA 95670 and is currently estimated at $333,904, approximately $274 per square foot. 2369 Cobbleoak Ct Unit 91 is a home located in Sacramento County with nearby schools including Williamson Elementary School, W.E. Mitchell Middle School, and Cordova High School.
Ownership History
Date
Name
Owned For
Owner Type
Purchase Details
Closed on
Apr 11, 2024
Sold by
Bowers Kenneth
Bought by
Kenneth E Bowers Living Trust and Bowers
Current Estimated Value
Purchase Details
Closed on
Nov 8, 2012
Sold by
U S Bank National Association
Bought by
Lam Rick and Tang Ling
Purchase Details
Closed on
Jan 17, 2003
Sold by
Best Rachel E
Bought by
Bowers Kenneth and Bowers Mitzi
Home Financials for this Owner
Home Financials are based on the most recent Mortgage that was taken out on this home.
Original Mortgage
$153,497
Interest Rate
5.96%
Mortgage Type
FHA
Purchase Details
Closed on
Dec 28, 2000
Sold by
Thomas Hargrove James
Bought by
Best Rachel E
Home Financials for this Owner
Home Financials are based on the most recent Mortgage that was taken out on this home.
Original Mortgage
$101,850
Interest Rate
7.71%
Mortgage Type
Purchase Money Mortgage
Create a Home Valuation Report for This Property
The Home Valuation Report is an in-depth analysis detailing your home's value as well as a comparison with similar homes in the area
Home Values in the Area
Average Home Value in this Area
Purchase History
| Date | Buyer | Sale Price | Title Company |
|---|---|---|---|
| Kenneth E Bowers Living Trust | -- | None Listed On Document | |
| Lam Rick | $86,000 | None Available | |
| Bowers Kenneth | $158,000 | North American Title Company | |
| Best Rachel E | $105,000 | North American Title Co |
Source: Public Records
Mortgage History
| Date | Status | Borrower | Loan Amount |
|---|---|---|---|
| Previous Owner | Bowers Kenneth | $153,497 | |
| Previous Owner | Best Rachel E | $101,850 | |
| Closed | Best Rachel E | $3,150 | |
| Closed | Bowers Kenneth | $8,000 |
Source: Public Records
Tax History Compared to Growth
Tax History
| Year | Tax Paid | Tax Assessment Tax Assessment Total Assessment is a certain percentage of the fair market value that is determined by local assessors to be the total taxable value of land and additions on the property. | Land | Improvement |
|---|---|---|---|---|
| 2025 | $2,611 | $228,813 | $36,196 | $192,617 |
| 2024 | $2,611 | $224,328 | $35,487 | $188,841 |
| 2023 | $2,559 | $219,931 | $34,792 | $185,139 |
| 2022 | $2,526 | $215,619 | $34,110 | $181,509 |
| 2021 | $2,476 | $211,392 | $33,442 | $177,950 |
| 2020 | $2,460 | $209,226 | $33,100 | $176,126 |
| 2019 | $2,419 | $205,124 | $32,451 | $172,673 |
| 2018 | $2,356 | $201,103 | $31,815 | $169,288 |
| 2017 | $2,296 | $197,161 | $31,192 | $165,969 |
| 2016 | $2,270 | $193,296 | $30,581 | $162,715 |
| 2015 | $2,056 | $181,904 | $28,779 | $153,125 |
| 2014 | $2,104 | $171,608 | $27,150 | $144,458 |
Source: Public Records
Map
Nearby Homes
- 2022 Zinfandel Dr Unit 76
- 2352 Bridlewood Dr
- 11085 Autumnwind Ln
- 367 Ravine Cir
- 376 Spreading Oak Ln
- 366 Ravine Cir
- 259 Rocky Hills Ln
- 270 Heritage Glen Ln
- 143 Gumtree Dr
- 328 Sierra Vista Dr
- 2201 Zinfandel Dr
- 472 Oleander View Way
- 106 Wilderness Rd
- 2200 Kimwood Ln
- 2255 El Manto Dr
- 2204 Athens River Ct
- 2216 Broad River Ct
- 1912 Benita Dr Unit 1
- 11100 Trinity River Dr
- 10881 Coloma Rd Unit 1
- 2363 Cobbleoak Ct
- 11051 Cobblestone Dr
- 2373 Cobbleoak Ct Unit 93
- 2366 Cobbleoak Ct Unit 85
- 2375 Cobbleoak Ct
- 11057 Cobblestone Dr Unit 99
- 2371 Cobbleoak Ct
- 2374 Cobbleoak Ct
- 11049 Cobblestone Dr Unit 97
- 2364 Cobbleoak Ct
- 2360 Cobbleoak Ct Unit 88
- 2372 Cobbleoak Ct
- 11059 Cobblestone Dr Unit 100
- 11043 Cobblestone Dr
- 2361 Cobbleoak Ct
- 2368 Cobbleoak Ct
- 2370 Cobbleoak Ct
- 11041 Cobblestone Dr Unit 95
- 2362 Cobbleoak Ct
- 2028 Zinfandel Dr