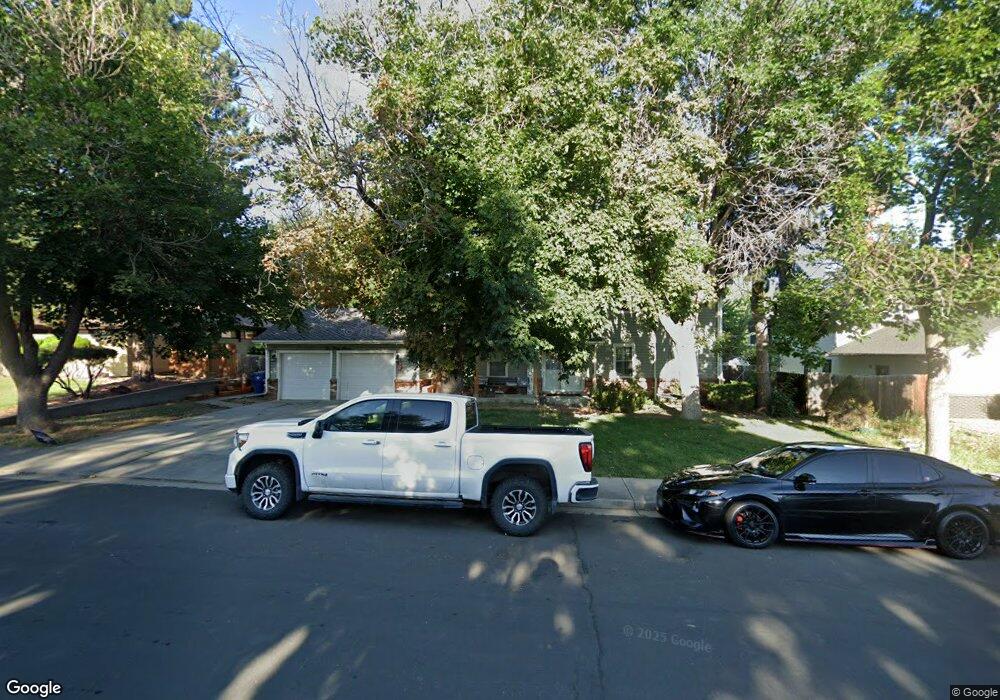
237 S Ursula St Aurora, CO 80012
Aurora Hills NeighborhoodEstimated Value: $505,000 - $554,622
4
Beds
4
Baths
3,574
Sq Ft
$151/Sq Ft
Est. Value
About This Home
This home is located at 237 S Ursula St, Aurora, CO 80012 and is currently estimated at $539,156, approximately $150 per square foot. 237 S Ursula St is a home located in Arapahoe County with nearby schools including Aurora Hills Middle School, Aurora Central High School, and Lotus School for Excellence.
Ownership History
Date
Name
Owned For
Owner Type
Purchase Details
Closed on
Apr 1, 2020
Sold by
Brezzel Jesse
Bought by
Garcia Luis Araluce
Current Estimated Value
Home Financials for this Owner
Home Financials are based on the most recent Mortgage that was taken out on this home.
Original Mortgage
$389,500
Outstanding Balance
$342,794
Interest Rate
3.4%
Mortgage Type
New Conventional
Estimated Equity
$196,362
Purchase Details
Closed on
May 30, 2007
Sold by
Douglas Parker and Douglas Frances
Bought by
Brezzel Jesse
Home Financials for this Owner
Home Financials are based on the most recent Mortgage that was taken out on this home.
Original Mortgage
$54,990
Interest Rate
5.89%
Mortgage Type
Stand Alone Second
Purchase Details
Closed on
Jun 1, 1978
Sold by
Conversion Arapco
Bought by
Conversion Arapco
Purchase Details
Closed on
Jul 4, 1776
Bought by
Conversion Arapco
Create a Home Valuation Report for This Property
The Home Valuation Report is an in-depth analysis detailing your home's value as well as a comparison with similar homes in the area
Home Values in the Area
Average Home Value in this Area
Purchase History
| Date | Buyer | Sale Price | Title Company |
|---|---|---|---|
| Garcia Luis Araluce | $410,000 | Ascendant Title Company | |
| Brezzel Jesse | $274,950 | Fa | |
| Conversion Arapco | -- | -- | |
| Conversion Arapco | -- | -- |
Source: Public Records
Mortgage History
| Date | Status | Borrower | Loan Amount |
|---|---|---|---|
| Open | Garcia Luis Araluce | $389,500 | |
| Previous Owner | Brezzel Jesse | $54,990 | |
| Previous Owner | Brezzel Jesse | $219,960 |
Source: Public Records
Tax History
| Year | Tax Paid | Tax Assessment Tax Assessment Total Assessment is a certain percentage of the fair market value that is determined by local assessors to be the total taxable value of land and additions on the property. | Land | Improvement |
|---|---|---|---|---|
| 2025 | $3,249 | $36,294 | -- | -- |
| 2024 | $3,152 | $33,909 | -- | -- |
| 2023 | $3,152 | $33,909 | $0 | $0 |
| 2022 | $2,873 | $28,613 | $0 | $0 |
| 2021 | $2,966 | $28,613 | $0 | $0 |
| 2020 | $2,274 | $28,986 | $0 | $0 |
| 2019 | $2,261 | $28,986 | $0 | $0 |
| 2018 | $1,944 | $25,589 | $0 | $0 |
| 2017 | $2,354 | $25,589 | $0 | $0 |
| 2016 | $2,053 | $21,850 | $0 | $0 |
| 2015 | $1,981 | $21,850 | $0 | $0 |
| 2014 | $1,657 | $17,600 | $0 | $0 |
| 2013 | -- | $17,240 | $0 | $0 |
Source: Public Records
Map
Nearby Homes
- 365 S Ursula Way
- 12802 E Nevada Cir
- 418 S Wheeling Way
- 429 S Victor Way
- 373 S Troy St
- 151 Potomac St
- 225 Tucson St
- 262 Victor St
- 13086 E Alaska Ave
- 12403 E Nevada Ave
- 300 Ursula St
- 12466 E Alaska Place
- 12446 E Alaska Place
- 365 Titan St
- 14241 E 1st Dr Unit 304
- 14211 E 1st Dr Unit 307
- 14211 E 1st Dr Unit 102
- 14251 E 1st Dr Unit 308
- 12024 E Maple Ave
- 14313 E 1st Dr Unit 208
- 207 S Ursula St
- 257 S Ursula St
- 206 S Tucson Cir
- 236 S Tucson Cir
- 277 S Ursula St
- 256 S Tucson Cir
- 13004 E Cedar Ave
- 238 S Ursula St
- 276 S Tucson Cir
- 258 S Ursula St
- 12991 E Cedar Ave
- 12961 E Cedar Ave
- 13034 E Cedar Ave
- 297 S Ursula St
- 278 S Ursula St
- 12931 E Cedar Ave
- 196 S Ursula St
- 296 S Tucson Cir
- 205 S Tucson Cir
- 12901 E Cedar Ave
Your Personal Tour Guide
Ask me questions while you tour the home.