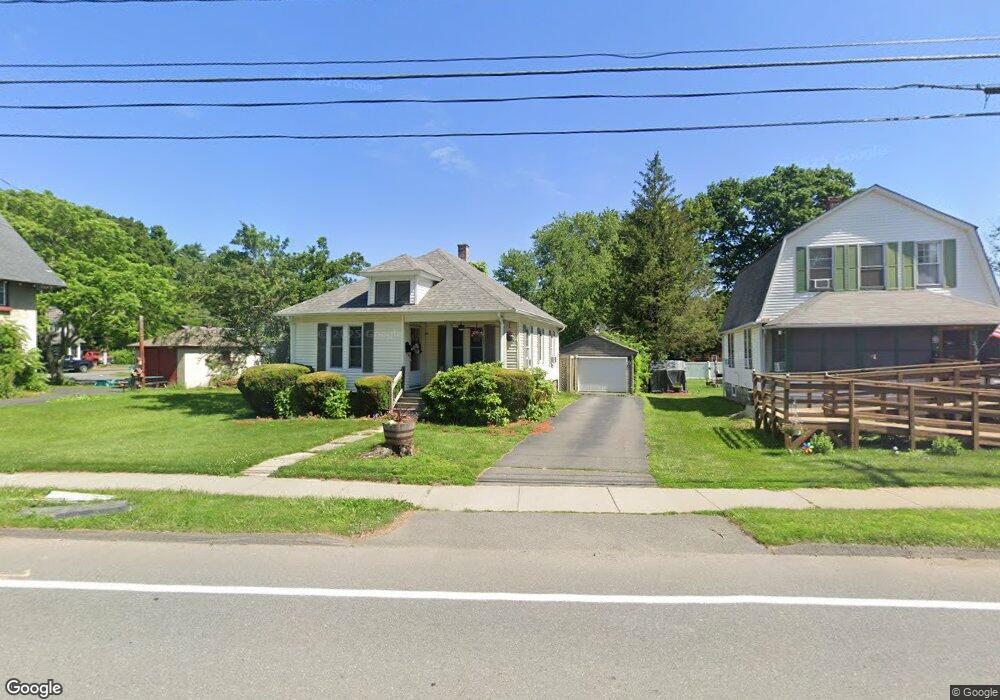
237 Silver St Greenfield, MA 01301
Estimated Value: $255,000 - $354,000
2
Beds
1
Bath
872
Sq Ft
$359/Sq Ft
Est. Value
About This Home
This home is located at 237 Silver St, Greenfield, MA 01301 and is currently estimated at $313,387, approximately $359 per square foot. 237 Silver St is a home located in Franklin County with nearby schools including Cornerstone Christian School, Holy Trinity School, and Stoneleigh-Burnham School.
Ownership History
Date
Name
Owned For
Owner Type
Purchase Details
Closed on
May 13, 2025
Sold by
Harker Joshua K and Wapner Amanda C
Bought by
Wapner Amanda C
Current Estimated Value
Purchase Details
Closed on
Nov 16, 2007
Sold by
Briggs Dena M
Bought by
Wapner Amanda and Harker Joshua K
Home Financials for this Owner
Home Financials are based on the most recent Mortgage that was taken out on this home.
Original Mortgage
$132,000
Interest Rate
6.41%
Mortgage Type
Purchase Money Mortgage
Purchase Details
Closed on
Mar 31, 1999
Sold by
Ackermann F J and Ackermann Elaine L
Bought by
Briggs Dena M
Purchase Details
Closed on
Oct 24, 1991
Sold by
Gay William C and Gay Barbara Jurek
Bought by
Ackermann Frederick and Ackermann Elaine L
Create a Home Valuation Report for This Property
The Home Valuation Report is an in-depth analysis detailing your home's value as well as a comparison with similar homes in the area
Home Values in the Area
Average Home Value in this Area
Purchase History
| Date | Buyer | Sale Price | Title Company |
|---|---|---|---|
| Wapner Amanda C | -- | None Available | |
| Wapner Amanda C | -- | None Available | |
| Wapner Amanda | $165,000 | -- | |
| Wapner Amanda | $165,000 | -- | |
| Briggs Dena M | $95,000 | -- | |
| Briggs Dena M | $95,000 | -- | |
| Ackermann Frederick | $108,000 | -- | |
| Ackermann Frederick | $108,000 | -- |
Source: Public Records
Mortgage History
| Date | Status | Borrower | Loan Amount |
|---|---|---|---|
| Previous Owner | Ackermann Frederick | $172,151 | |
| Previous Owner | Wapner Amanda | $132,000 |
Source: Public Records
Tax History
| Year | Tax Paid | Tax Assessment Tax Assessment Total Assessment is a certain percentage of the fair market value that is determined by local assessors to be the total taxable value of land and additions on the property. | Land | Improvement |
|---|---|---|---|---|
| 2025 | $4,659 | $238,200 | $68,600 | $169,600 |
| 2024 | $4,588 | $225,000 | $56,500 | $168,500 |
| 2023 | $4,079 | $207,600 | $56,500 | $151,100 |
| 2022 | $4,156 | $186,200 | $53,800 | $132,400 |
| 2021 | $4,066 | $175,100 | $53,800 | $121,300 |
| 2020 | $3,772 | $164,500 | $53,800 | $110,700 |
| 2019 | $3,519 | $157,400 | $46,700 | $110,700 |
| 2018 | $3,461 | $154,300 | $45,700 | $108,600 |
| 2017 | $3,353 | $154,300 | $45,700 | $108,600 |
| 2016 | $3,315 | $152,000 | $48,400 | $103,600 |
| 2015 | $3,336 | $148,200 | $48,400 | $99,800 |
| 2014 | $3,040 | $148,100 | $48,400 | $99,700 |
Source: Public Records
Map
Nearby Homes
Your Personal Tour Guide
Ask me questions while you tour the home.