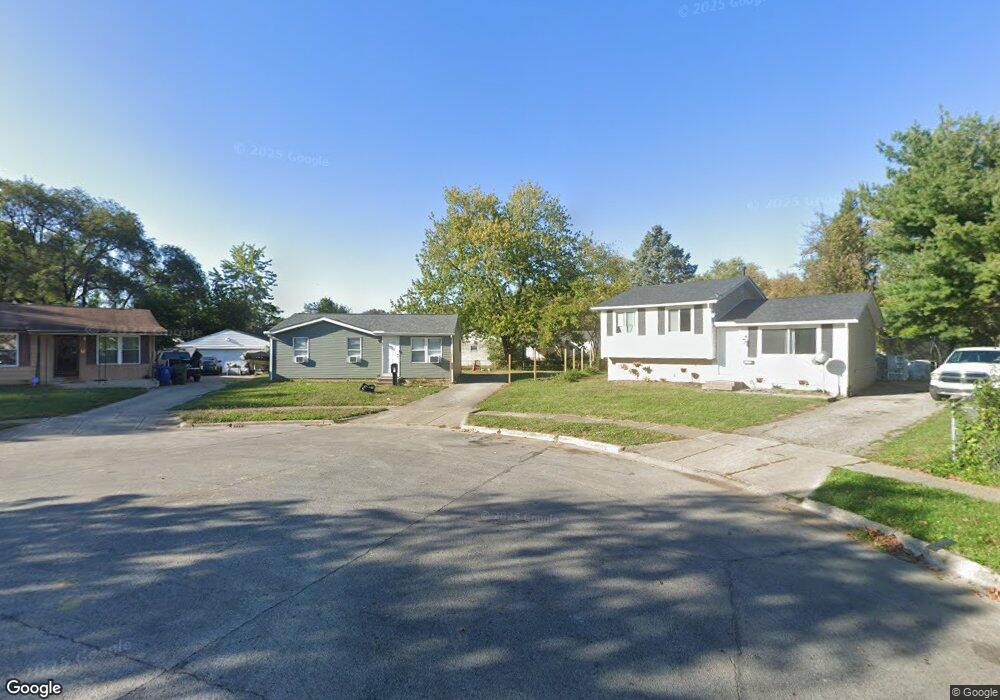
2371 Clarkston Ln Columbus, OH 43232
Glenbrook NeighborhoodEstimated Value: $139,000 - $177,000
3
Beds
1
Bath
836
Sq Ft
$193/Sq Ft
Est. Value
About This Home
This home is located at 2371 Clarkston Ln, Columbus, OH 43232 and is currently estimated at $161,517, approximately $193 per square foot. 2371 Clarkston Ln is a home located in Franklin County with nearby schools including Easthaven Elementary School, Yorktown Middle School, and Independence High School.
Ownership History
Date
Name
Owned For
Owner Type
Purchase Details
Closed on
Nov 20, 2006
Sold by
Hud
Bought by
Copeland Cheryl A
Current Estimated Value
Home Financials for this Owner
Home Financials are based on the most recent Mortgage that was taken out on this home.
Original Mortgage
$54,089
Outstanding Balance
$49,225
Interest Rate
11.05%
Mortgage Type
Purchase Money Mortgage
Estimated Equity
$112,292
Purchase Details
Closed on
Jan 23, 2006
Sold by
Young Michele L and Citimortgage Inc
Bought by
Hud
Purchase Details
Closed on
Feb 15, 2002
Sold by
Purtee Lewis R
Bought by
Young Michele L
Home Financials for this Owner
Home Financials are based on the most recent Mortgage that was taken out on this home.
Original Mortgage
$74,808
Interest Rate
6.92%
Mortgage Type
FHA
Purchase Details
Closed on
Apr 17, 1989
Bought by
Purtee Lewis R
Create a Home Valuation Report for This Property
The Home Valuation Report is an in-depth analysis detailing your home's value as well as a comparison with similar homes in the area
Home Values in the Area
Average Home Value in this Area
Purchase History
| Date | Buyer | Sale Price | Title Company |
|---|---|---|---|
| Copeland Cheryl A | $60,099 | Lakeside | |
| Hud | $48,000 | None Available | |
| Young Michele L | $75,400 | -- | |
| Purtee Lewis R | -- | -- |
Source: Public Records
Mortgage History
| Date | Status | Borrower | Loan Amount |
|---|---|---|---|
| Open | Copeland Cheryl A | $54,089 | |
| Previous Owner | Young Michele L | $74,808 |
Source: Public Records
Tax History
| Year | Tax Paid | Tax Assessment Tax Assessment Total Assessment is a certain percentage of the fair market value that is determined by local assessors to be the total taxable value of land and additions on the property. | Land | Improvement |
|---|---|---|---|---|
| 2025 | $3,117 | $45,540 | $17,470 | $28,070 |
| 2024 | $3,117 | $45,540 | $17,470 | $28,070 |
| 2023 | $2,061 | $45,535 | $17,465 | $28,070 |
| 2022 | $1,127 | $21,210 | $8,750 | $12,460 |
| 2021 | $1,129 | $21,210 | $8,750 | $12,460 |
| 2020 | $1,131 | $21,210 | $8,750 | $12,460 |
| 2019 | $1,151 | $16,100 | $7,000 | $9,100 |
| 2018 | $1,165 | $16,100 | $7,000 | $9,100 |
| 2017 | $1,129 | $16,100 | $7,000 | $9,100 |
| 2016 | $1,375 | $18,280 | $3,820 | $14,460 |
| 2015 | $1,181 | $18,280 | $3,820 | $14,460 |
| 2014 | $1,133 | $18,280 | $3,820 | $14,460 |
| 2013 | $639 | $19,250 | $4,025 | $15,225 |
Source: Public Records
Map
Nearby Homes
- 2275 Cardston Ct
- 2251 Meridian Ct
- 3745 Wynds Dr
- 3830 Charbonnett Ct Unit 6-A
- 3466 Westpoint Dr
- 0 Rotunda Dr Unit 271
- 2278 Wadsworth Dr Unit D
- 3036 Wadsworth Ct
- 3038 Wadsworth Ct
- 4375 Refugee Rd
- 3328 Penfield Rd
- 1884 Barnett Ct W
- 2942 Arrowhead Ct
- 3777 E Deshler Ave
- 3325 E Deshler Ave
- 2825 S Hampton Rd
- 3428 LIV Moor Dr
- 0 Eastpoint Dr
- 3457 Roswell Dr
- 0 Groves Rd
- 2377 Clarkston Ln
- 2374 Clarkston Ln
- 3475 Oakcrest Rd
- 3469 Oakcrest Rd
- 2383 Clarkston Ln
- 3483 Oakcrest Rd
- 3463 Oakcrest Rd
- 2380 Clarkston Ln
- 2389 Clarkston Ln
- 3489 Oakcrest Rd
- 2372 Millerton St
- 3438 Bruceton Ave
- 2386 Clarkston Ln
- 3453 Oakcrest Rd
- 2378 Millerton St
- 2392 Clarkston Ln
- 2395 Clarkston Ln
- 3499 Oakcrest Rd Unit 501
- 3447 Oakcrest Rd
- 3432 Bruceton Ave
Your Personal Tour Guide
Ask me questions while you tour the home.