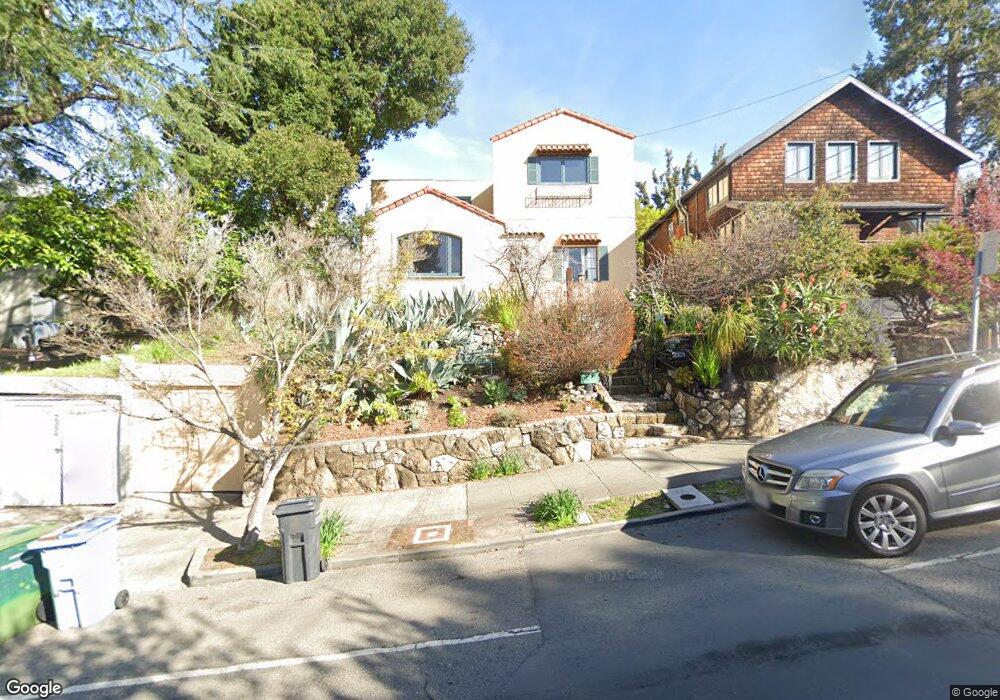
2371 Eunice St Berkeley, CA 94708
Berkeley Hills NeighborhoodEstimated Value: $1,915,000 - $2,178,000
5
Beds
3
Baths
2,400
Sq Ft
$852/Sq Ft
Est. Value
About This Home
This home is located at 2371 Eunice St, Berkeley, CA 94708 and is currently estimated at $2,045,162, approximately $852 per square foot. 2371 Eunice St is a home located in Alameda County with nearby schools including Cragmont Elementary School, Berkeley Arts Magnet at Whittier School, and Washington Elementary School.
Ownership History
Date
Name
Owned For
Owner Type
Purchase Details
Closed on
Oct 17, 2025
Sold by
Morris Michael and Bruno Gina
Bought by
Bruno-Morris Family Trust and Morris
Current Estimated Value
Purchase Details
Closed on
Oct 1, 2019
Sold by
Stenvoll Thomas and Wells Daryl
Bought by
Morris Michael and Bruno Gina
Home Financials for this Owner
Home Financials are based on the most recent Mortgage that was taken out on this home.
Original Mortgage
$1,195,000
Interest Rate
3.4%
Mortgage Type
New Conventional
Purchase Details
Closed on
Mar 29, 2015
Sold by
Brace Maxwell and Vander Pluym Andrea R
Bought by
Stenvoll Thomas and Wells Daryl
Home Financials for this Owner
Home Financials are based on the most recent Mortgage that was taken out on this home.
Original Mortgage
$1,052,100
Interest Rate
3.64%
Mortgage Type
New Conventional
Purchase Details
Closed on
Jul 8, 2008
Sold by
Fierstein Fredric J
Bought by
Vander Brace Iv Maxwell and Vander Pluym Andrea R
Home Financials for this Owner
Home Financials are based on the most recent Mortgage that was taken out on this home.
Original Mortgage
$745,000
Interest Rate
6.45%
Mortgage Type
Purchase Money Mortgage
Purchase Details
Closed on
Mar 10, 2005
Sold by
Moskovitz Myron and Moskovitz Ruth
Bought by
Fierstein Fredric J
Home Financials for this Owner
Home Financials are based on the most recent Mortgage that was taken out on this home.
Original Mortgage
$800,050
Interest Rate
5.75%
Mortgage Type
Purchase Money Mortgage
Purchase Details
Closed on
Mar 2, 2005
Sold by
Moskovitz Myron and Moskovitz Ruth
Bought by
Moskovitz Myron and Moskovitz Ruth
Home Financials for this Owner
Home Financials are based on the most recent Mortgage that was taken out on this home.
Original Mortgage
$800,050
Interest Rate
5.75%
Mortgage Type
Purchase Money Mortgage
Purchase Details
Closed on
May 16, 2000
Sold by
Moskovitz Myron and Moskovitz Ruth
Bought by
Moskovitz Myron and Moskovitz Ruth
Create a Home Valuation Report for This Property
The Home Valuation Report is an in-depth analysis detailing your home's value as well as a comparison with similar homes in the area
Home Values in the Area
Average Home Value in this Area
Purchase History
| Date | Buyer | Sale Price | Title Company |
|---|---|---|---|
| Bruno-Morris Family Trust | -- | None Listed On Document | |
| Morris Michael | $1,695,000 | Old Republic Title Company | |
| Stenvoll Thomas | $1,503,000 | Chicago Title Company | |
| Vander Brace Iv Maxwell | $999,500 | Old Republic Title Company B | |
| Fierstein Fredric J | $1,000,500 | Placer Title Company | |
| Moskovitz Myron | -- | Placer Title Company | |
| Moskovitz Myron | -- | -- |
Source: Public Records
Mortgage History
| Date | Status | Borrower | Loan Amount |
|---|---|---|---|
| Previous Owner | Morris Michael | $1,195,000 | |
| Previous Owner | Stenvoll Thomas | $1,052,100 | |
| Previous Owner | Vander Brace Iv Maxwell | $745,000 | |
| Previous Owner | Fierstein Fredric J | $800,050 | |
| Closed | Fierstein Fredric J | $100,000 |
Source: Public Records
Tax History
| Year | Tax Paid | Tax Assessment Tax Assessment Total Assessment is a certain percentage of the fair market value that is determined by local assessors to be the total taxable value of land and additions on the property. | Land | Improvement |
|---|---|---|---|---|
| 2025 | $26,154 | $1,846,702 | $557,751 | $1,295,951 |
| 2024 | $26,154 | $1,810,361 | $546,816 | $1,270,545 |
| 2023 | $25,637 | $1,781,732 | $536,096 | $1,245,636 |
| 2022 | $25,229 | $1,739,798 | $525,585 | $1,221,213 |
| 2021 | $25,327 | $1,705,559 | $515,283 | $1,197,276 |
| 2020 | $24,068 | $1,695,000 | $510,000 | $1,185,000 |
| 2019 | $22,850 | $1,629,913 | $485,790 | $1,144,123 |
| 2018 | $22,498 | $1,597,962 | $476,267 | $1,121,695 |
| 2017 | $21,753 | $1,566,631 | $466,929 | $1,099,702 |
| 2016 | $21,014 | $1,525,920 | $457,776 | $1,068,144 |
| 2015 | $15,468 | $1,070,923 | $321,277 | $749,646 |
| 2014 | $15,359 | $1,049,954 | $314,986 | $734,968 |
Source: Public Records
Map
Nearby Homes
- 2315 Eunice St
- 2501 Rose Walk
- 2121 Eunice St
- 1106 Cragmont Ave
- 1004 Cragmont Ave
- 2686 Shasta Rd
- 1165 Cragmont Ave
- 962 Regal Rd
- 1155 Keeler Ave
- 1110 Sterling Ave
- 1515 Oxford St Unit 1D
- 1444 Walnut St
- 1950 Hopkins St
- 1160 Miller Ave
- 1622 Scenic Ave
- 1408 Henry St
- 2421 Hilgard Ave
- 1024 Grizzly Peak Blvd
- 1085 Creston Rd
- 2600 Hilgard Ave
Your Personal Tour Guide
Ask me questions while you tour the home.